Category: Projects

  • Mechanics-Guided Member Grouping for Cross-Section Optimization with Heterogeneous Graphs
    Shaoyi Wang, Tao Sun, Ramon E. Weber, and Simon Schleicher
    Proceedings of the IASS Annual Symposium 2026 · PDF via escholarship

    The design problem

    Optimizing every steel member independently can reduce weight, but it often creates too many different section sizes and a difficult search problem. The resulting design may be efficient on paper while becoming harder to fabricate, procure, coordinate, and converge computationally. This research asks whether structurally similar members can be identified first, then sized together as practical groups.

    Turning a structure into a graph

    The method represents a structural frame as a heterogeneous graph with two kinds of nodes: connection points and linear members. Each member carries geometric information and force responses from an initial finite-element simulation. Graph connections describe both physical incidence and adjacency between members.
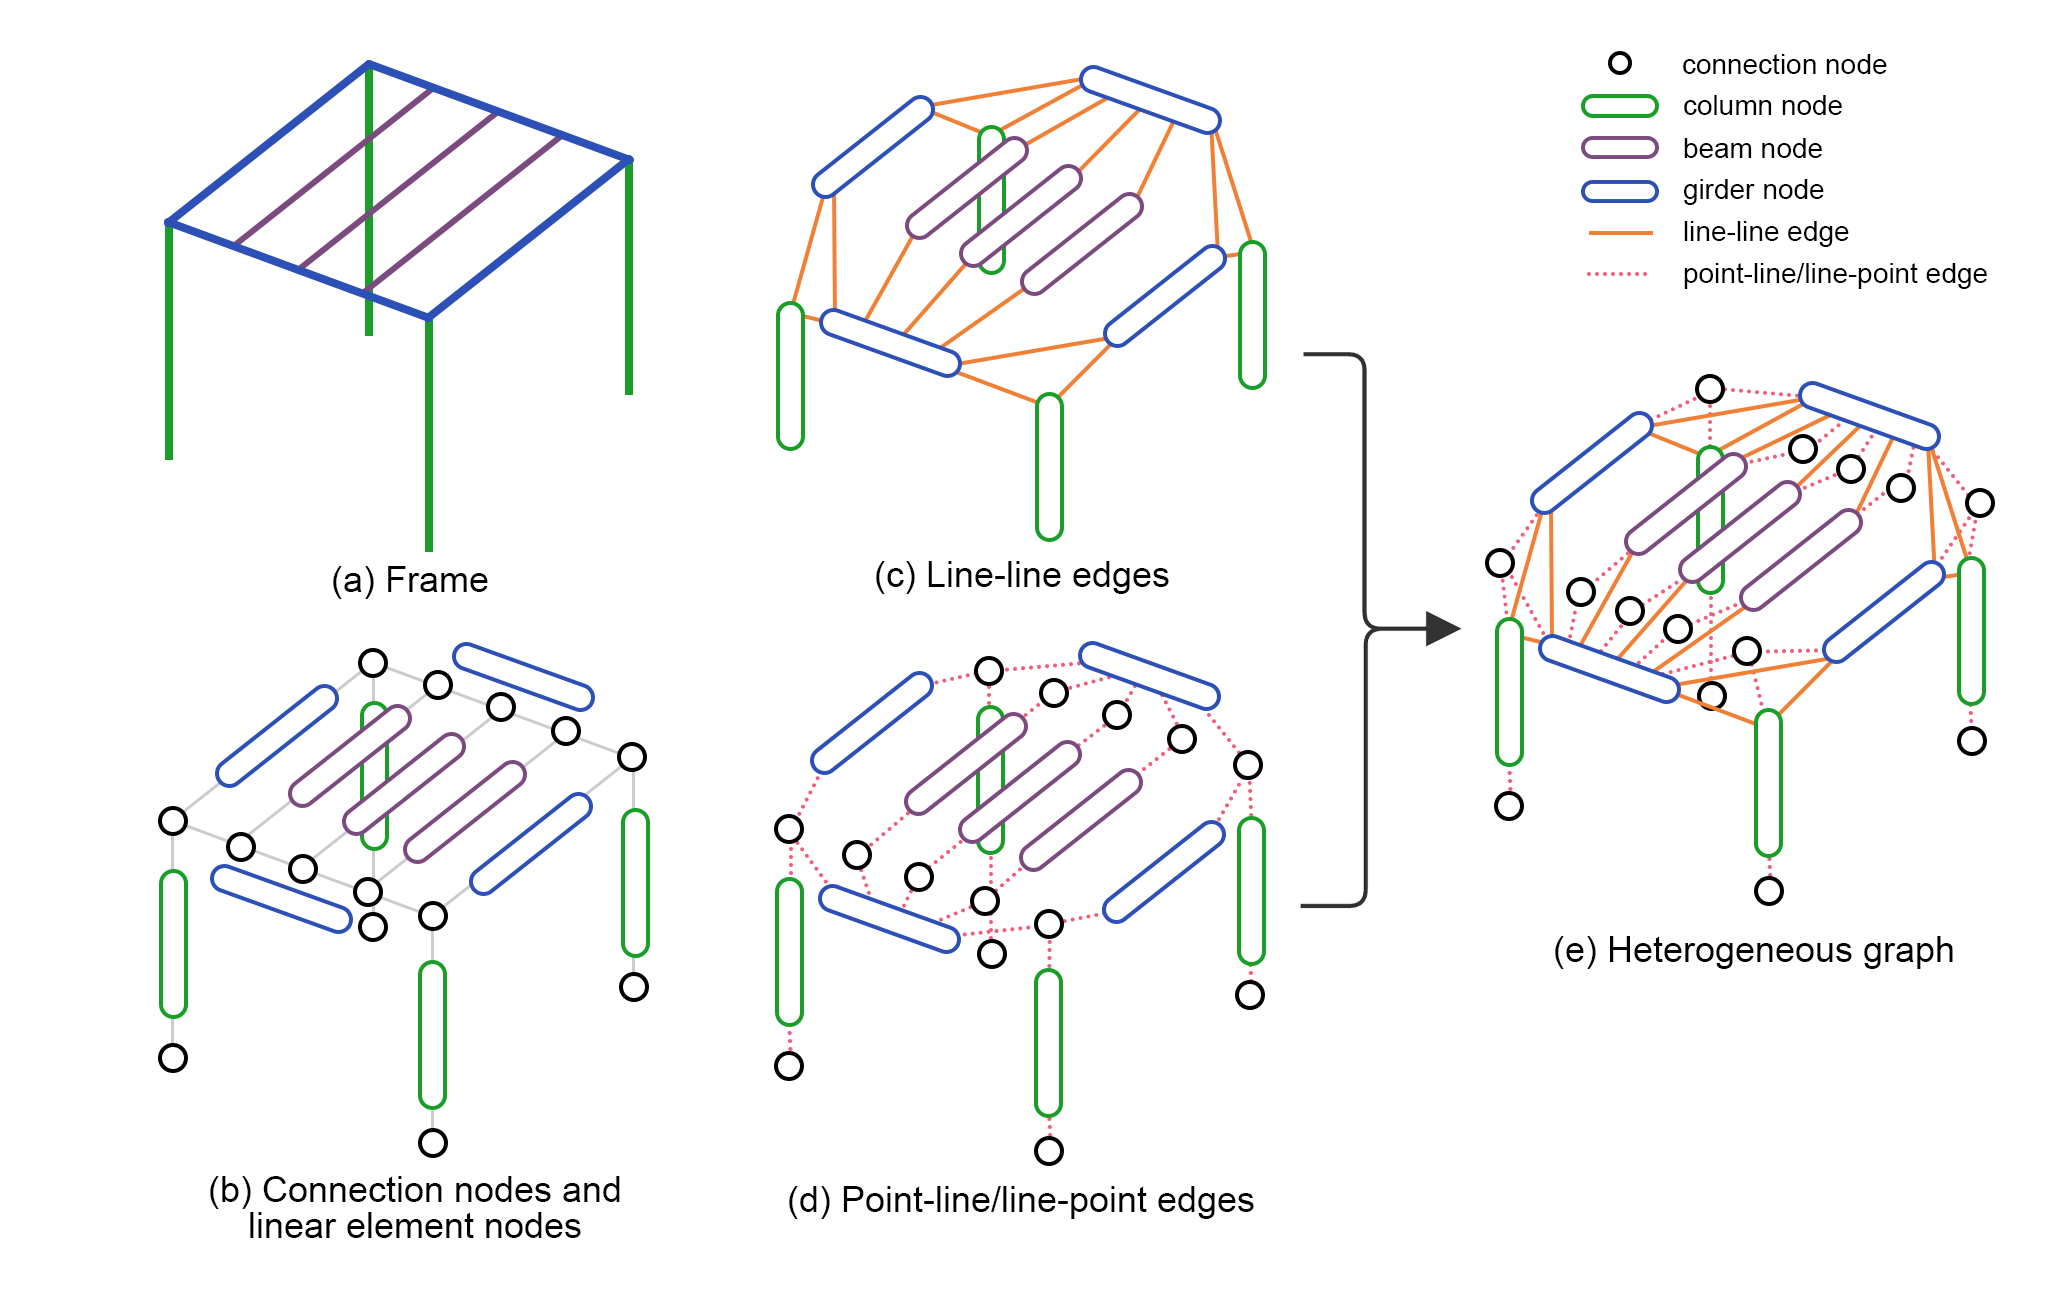
    Construction of the heterogeneous structural graph
    Connection points and structural members become different node types, while their physical relationships become graph edges.
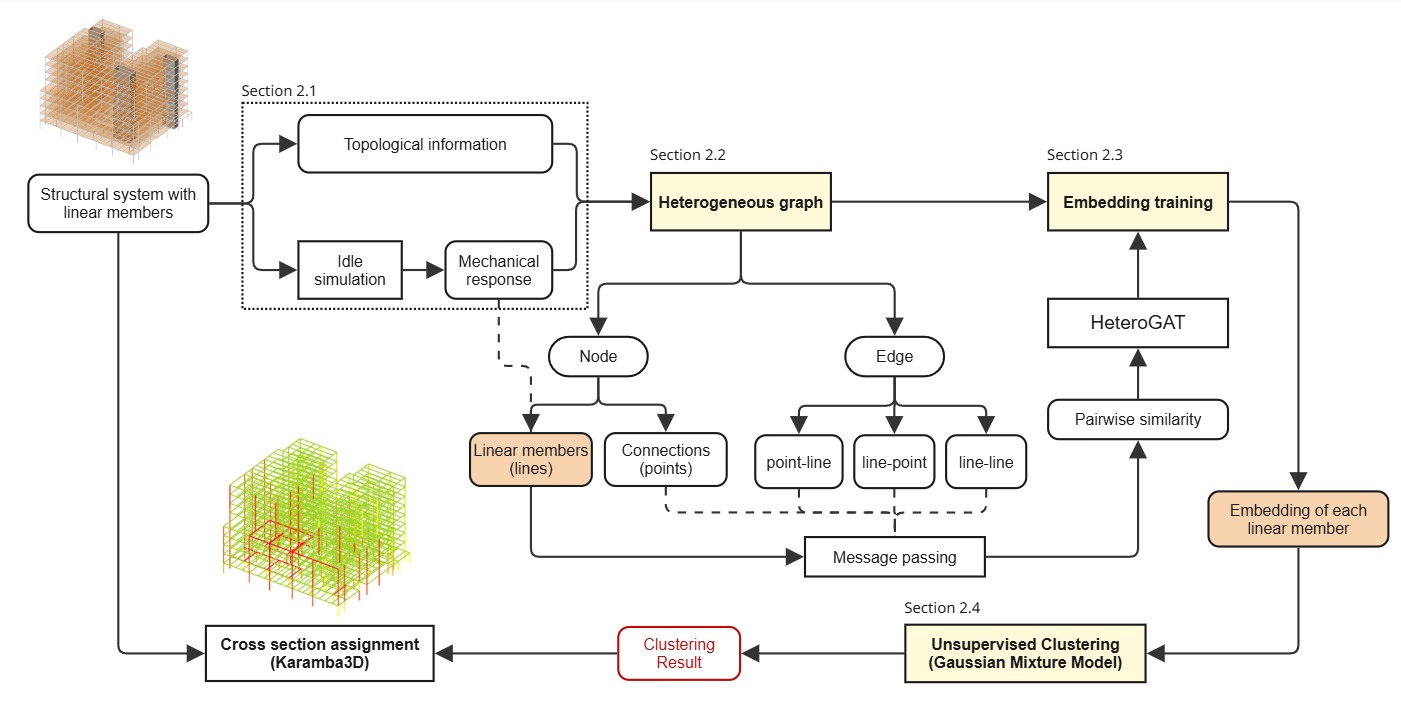
    Pipeline from structural simulation to graph learning, clustering, and cross-section assignment
    The pipeline combines simulation data, heterogeneous graph learning, unsupervised clustering, and grouped cross-section assignment.

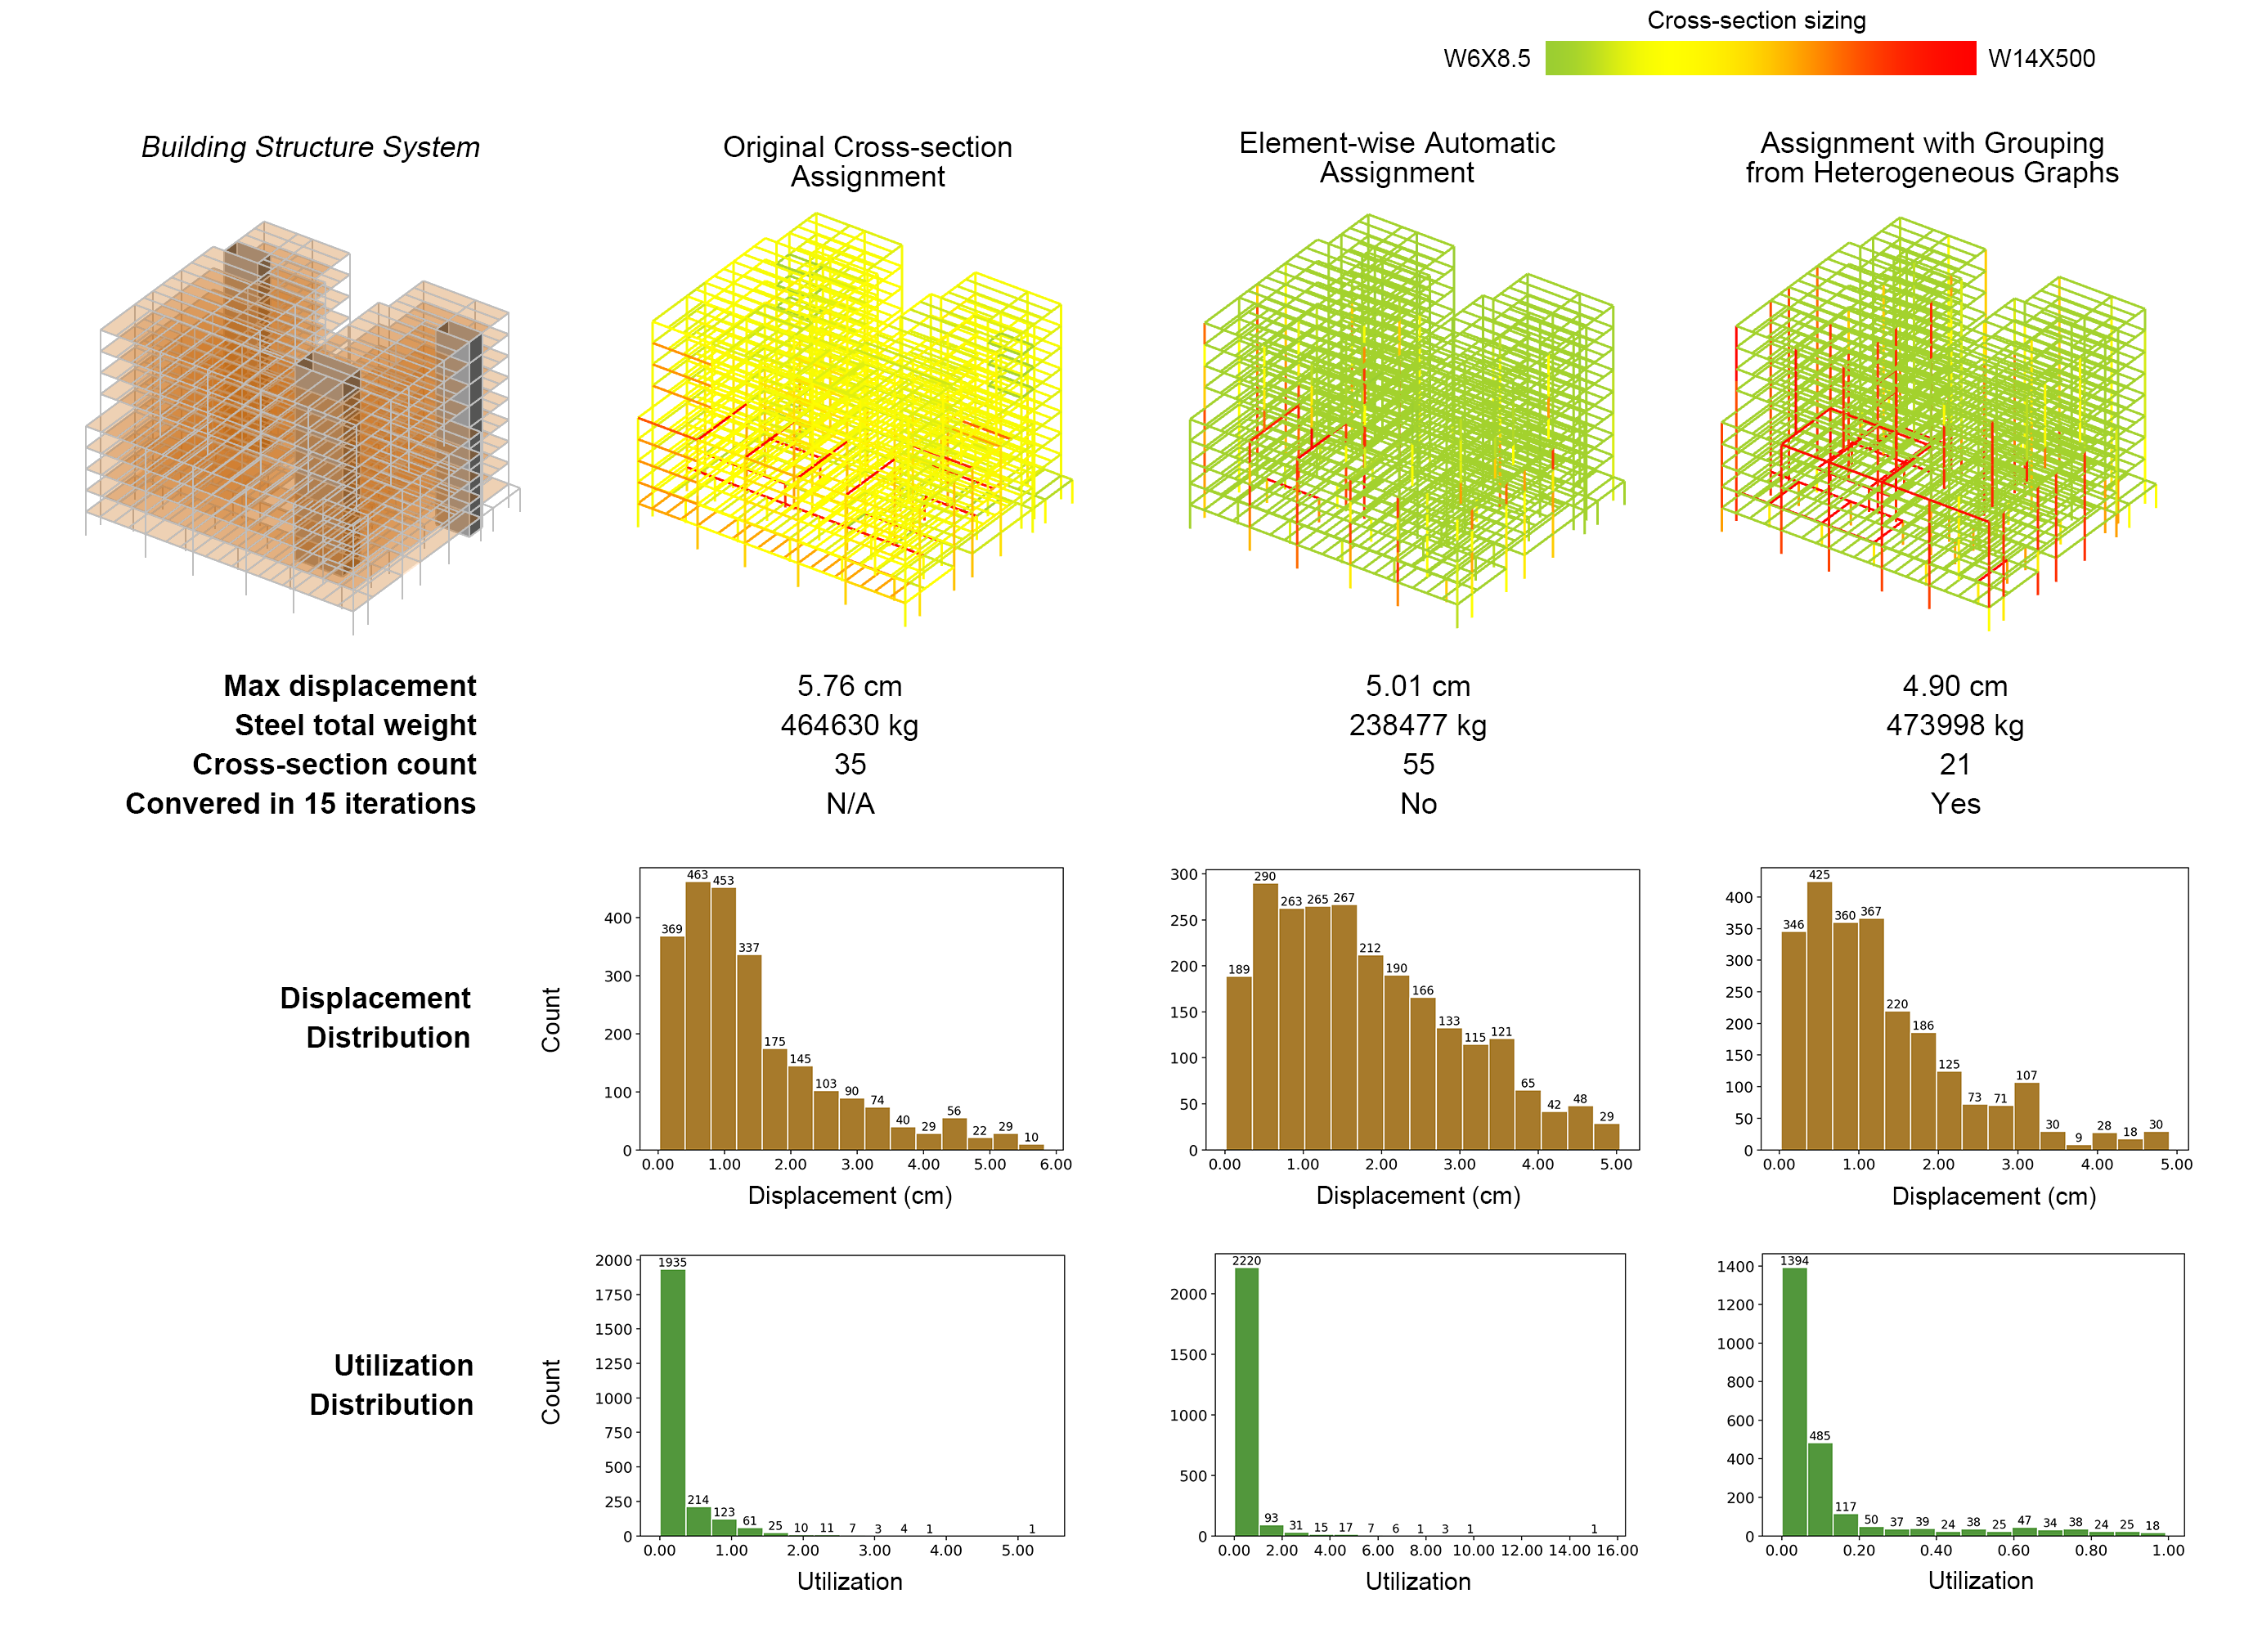
    Comparison of original, element-wise, and graph-grouped cross-section assignments
    Comparison of the original design, element-wise automatic sizing, and assignment using graph-based member groups.

    How the workflow works

    A Heterogeneous Graph Attention Network learns a compact representation for each member. Training brings members closer when they have similar mechanical responses or share structural connections. A Gaussian Mixture Model then clusters the learned representations separately for columns, girders, and beams. Finally, every member in a cluster shares a cross-section group during Karamba3D sizing.

    Case study

    The whole-building case study contains 2,395 steel members. The proposed method first reduces them to 120 learned groups, then assigns shared sections at the group level. The grouped solution converged within 15 iterations and used 21 cross-section types. By comparison, element-wise sizing produced 55 types and did not converge within the tested iteration limit.

    The grouped design achieved a maximum displacement of 4.90 cm, lower than the original reference design, while keeping total steel weight comparable to that reference. Member utilization stayed within a safer and more controlled range.

    Beyond one building

    Additional tests on a spatial truss and a gridshell suggest that the same idea can extend to different structural systems. The learned groups can recognize meaningful structural regions, such as a ring beam, while still allowing curved and irregular systems to be sized with a manageable set of sections.
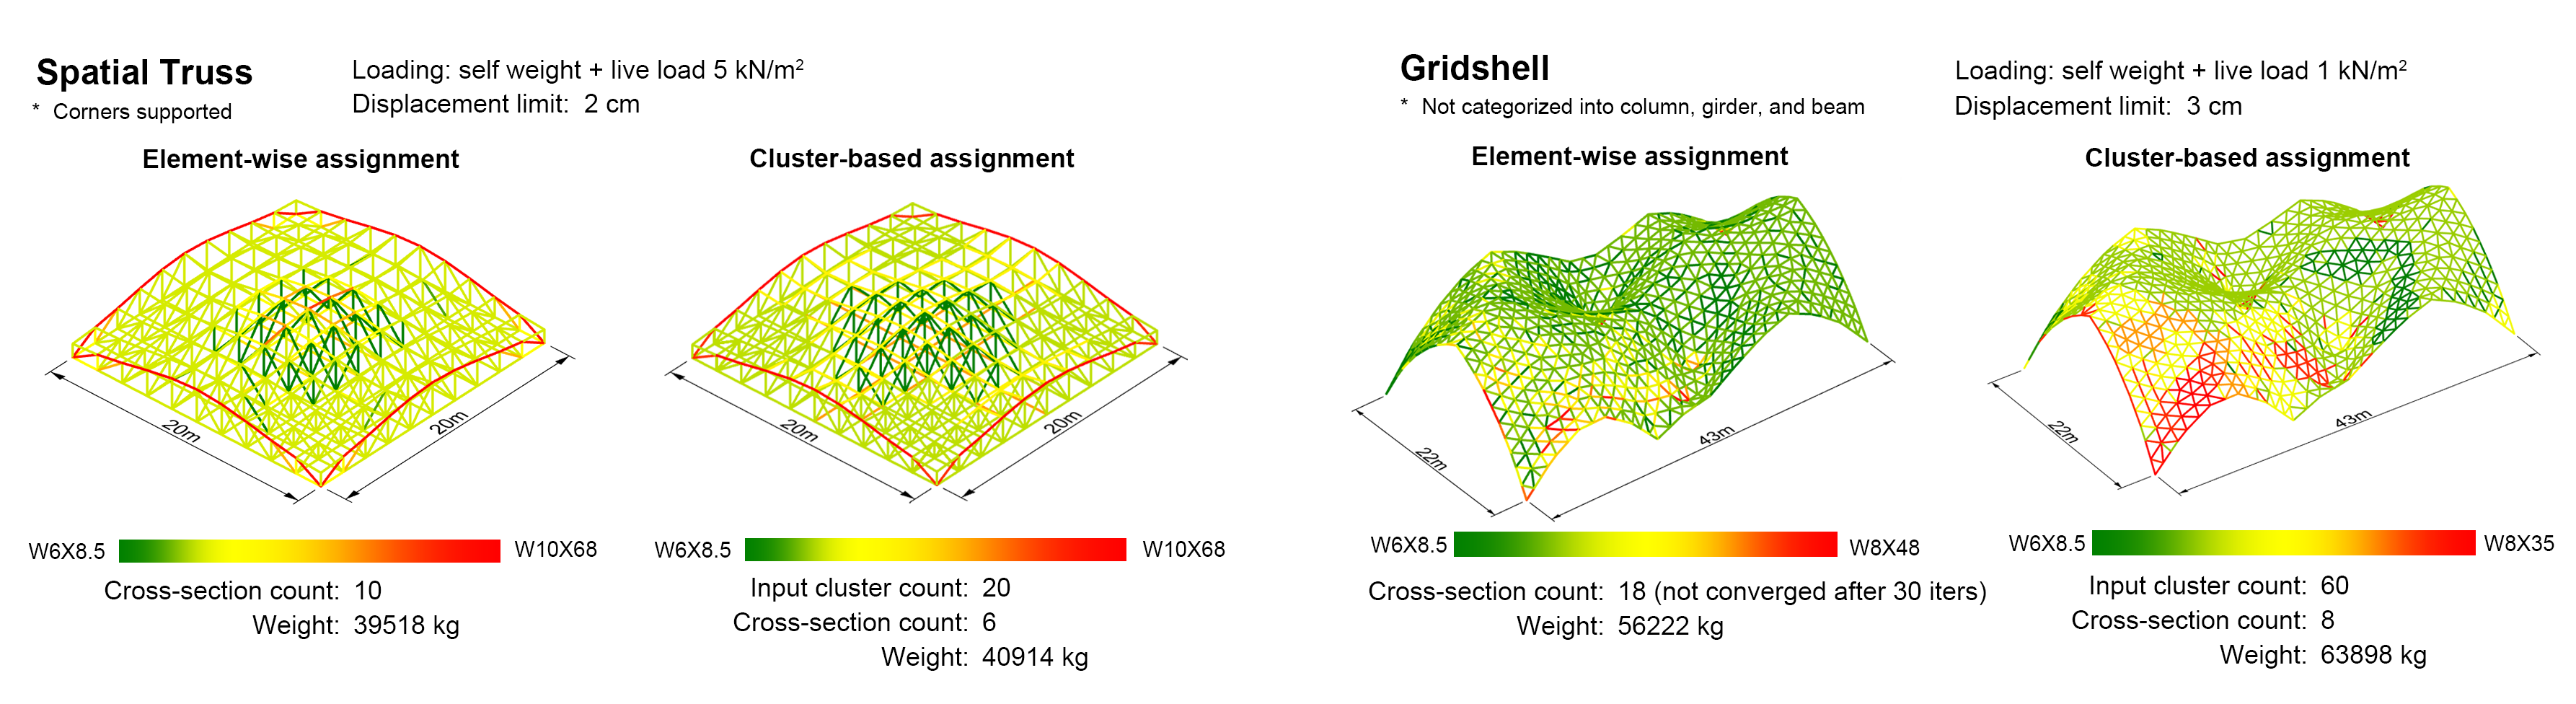
    Graph-based grouped sizing applied to a spatial truss and a gridshell
    Element-wise and cluster-based assignments for a spatial truss and a gridshell.

    Conclusion

    The method introduces a group-aware layer between structural analysis and sizing, helping designers balance structural performance with constructability and computational stability. This is useful during early-stage design, as clear and rationalized decisions for structural member selection can better shape next-step design.

    IASS 2026

    Mechanics-Guided Member Grouping for Cross-Section Optimization with Heterogeneous Graphs
    Shaoyi Wang, Tao Sun, Ramon E. Weber, and Simon Schleicher
    Proceedings of the IASS Annual Symposium 2026 · PDF via escholarship

    Cite — BibTeX
    @inproceedings{sun2026capturing,
    title = {Mechanics-Guided Member Grouping for Cross-Section Optimization with Heterogeneous Graphs},
    author = {Wang, Shaoyi and Sun, Tao and Weber, Ramon E. and Schleicher, Simon and},
    booktitle = {Proceedings of the IASS Annual Symposium},
    year = {2026},
    organization = {International Association for Shell and Spatial Structures}
    }
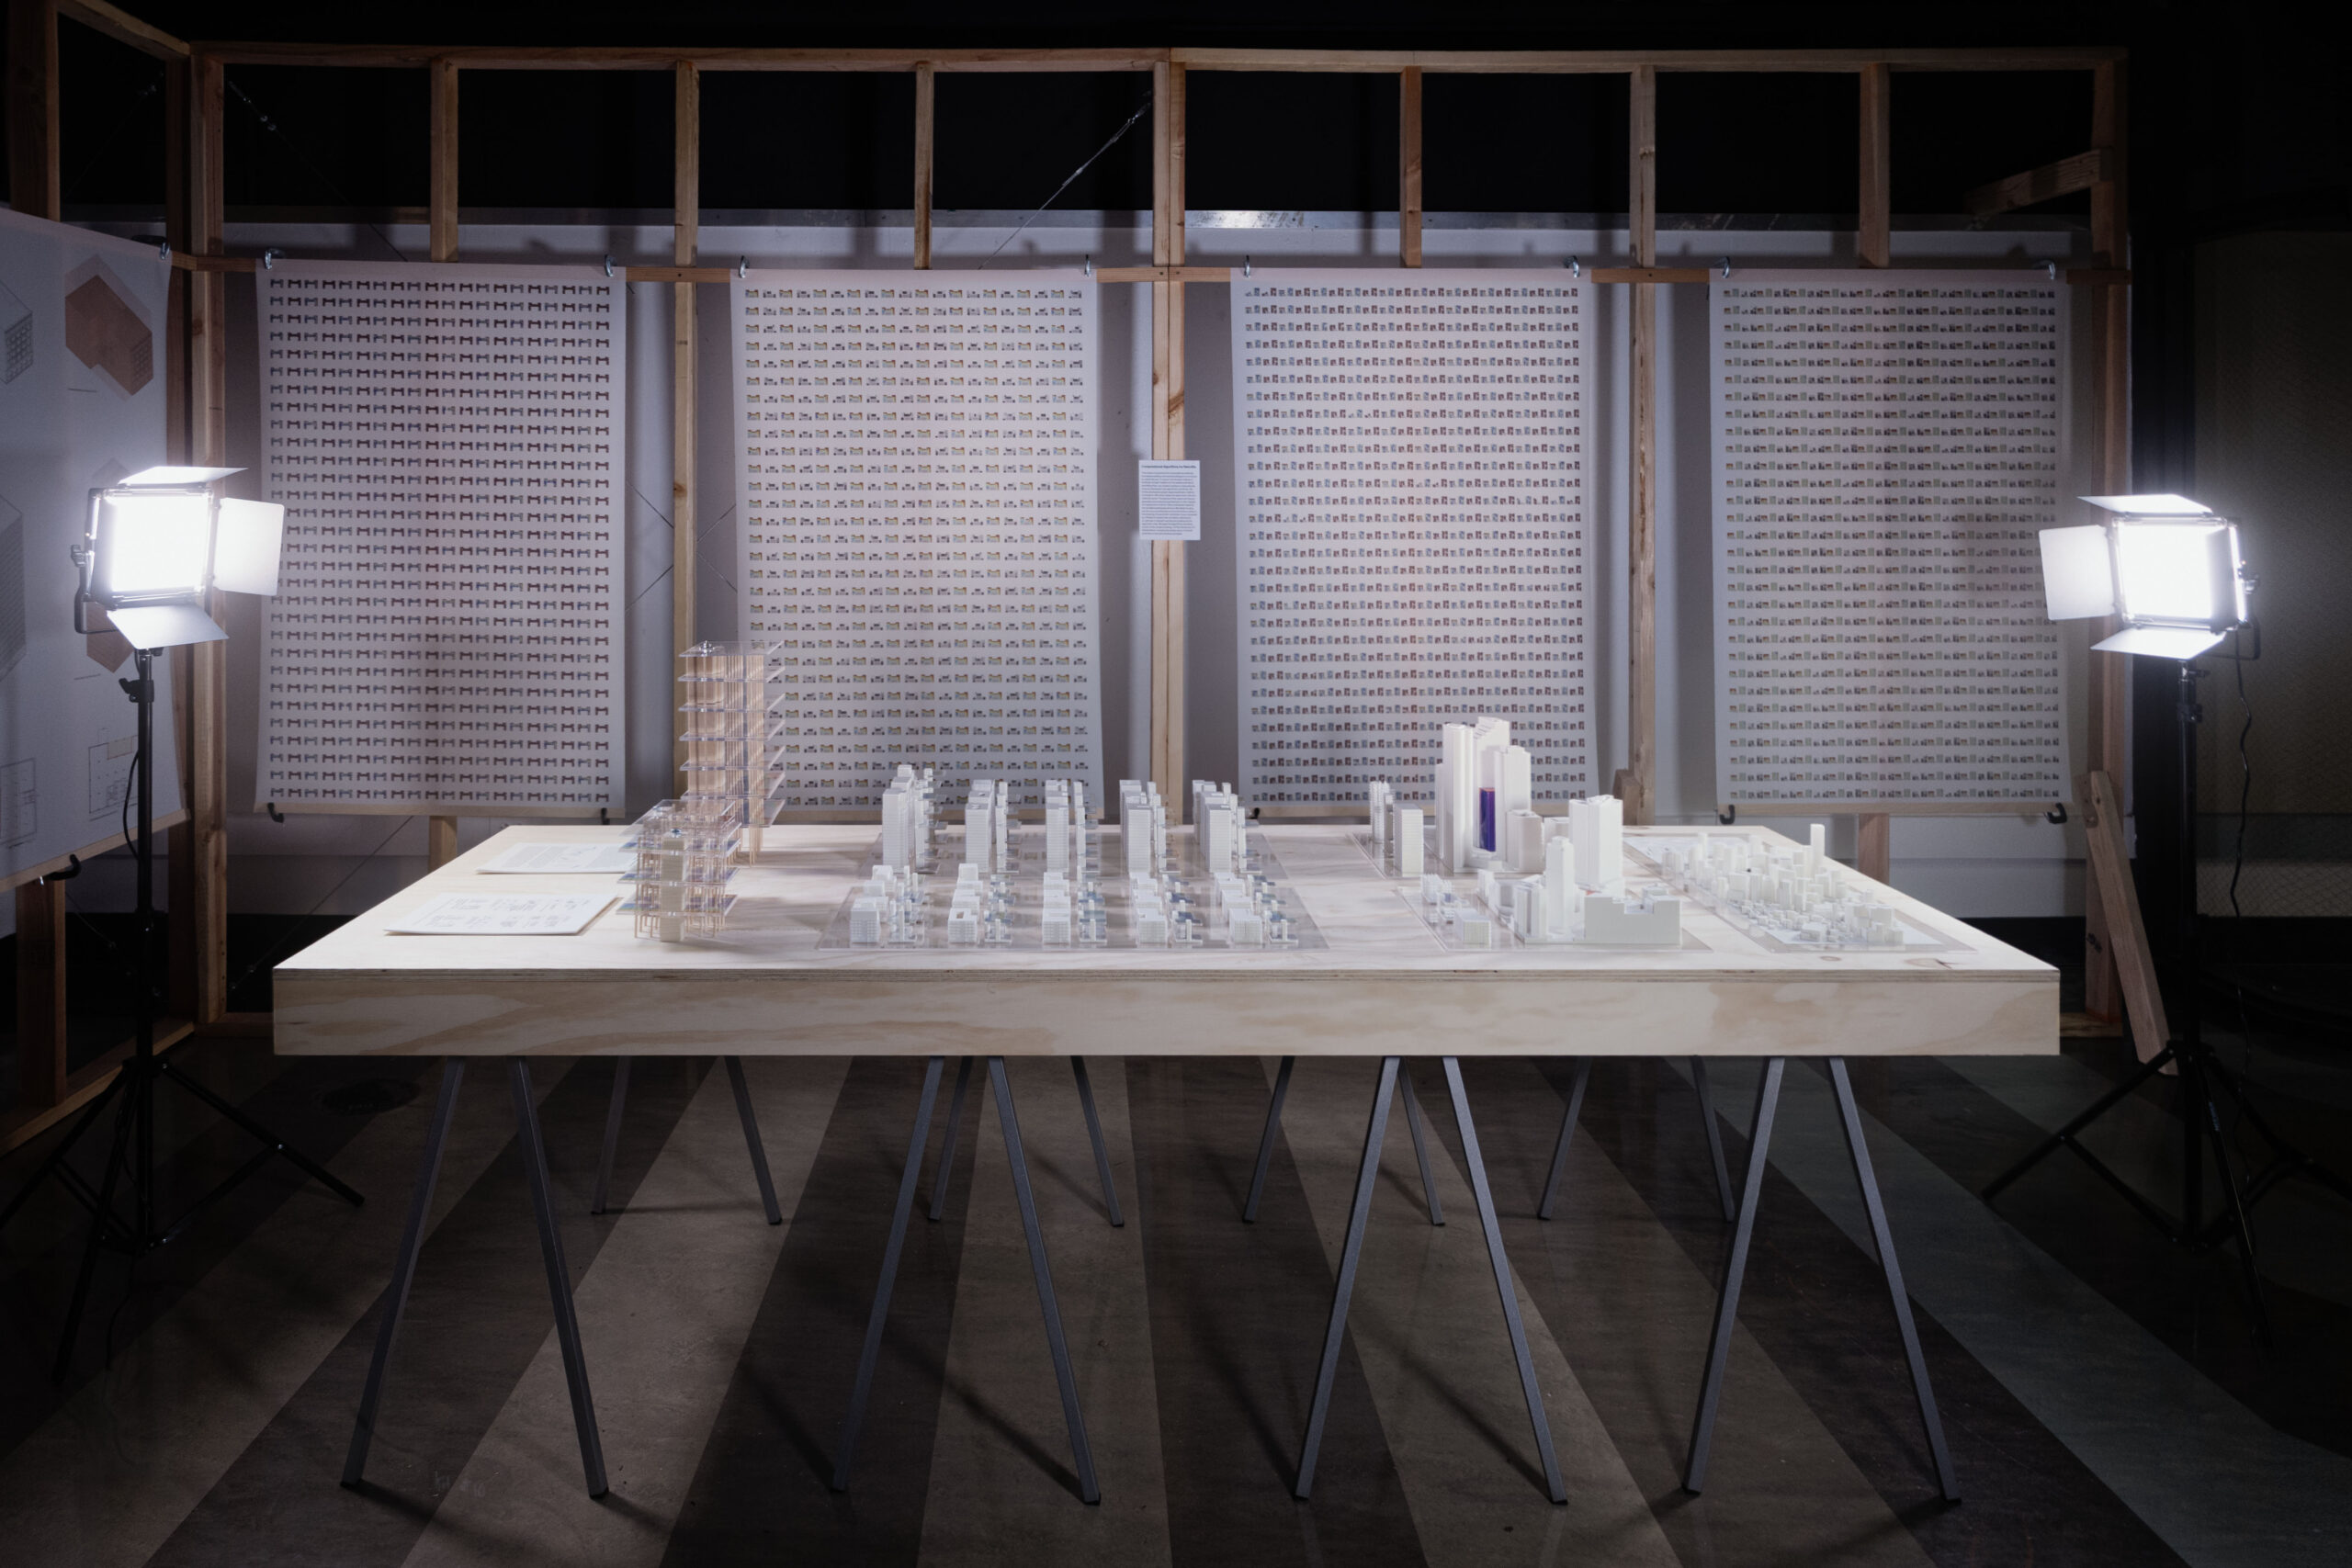
  • Exhibition, The Weather To Come: Forest, City, Fire, Cloud. UC Berkeley, Institute of Urban & Regional Development, SF Climate Week 2026

    Ramon Weber, Rae Zhao, Will Bartlett Suzuki, Soomin Park, Emma Nakaoka, Sihyeok Yang, Linc Ruiz-Truong, Hitiksha Bansal, and Wenzhuo Cai.

    This research explored strategies of how computational methods can assess existing commercial buildings for conversion to affordable residential use. Through both in depth architectural case studies and high-level urban data analysis we are approached the challenge from two different directions. Through an architectural lens we conducted an in-depth literature review of building retrofits in urban contexts to identify different architectural and structural design strategies that could be applied to office-to residential conversions. We created a catalogue of possible interventions that can be mapped to existing buildings. Through a technological lens we created algorithmic workflows that would allow for estimation of building retrofit potential and created new prototypes for design interfaces for architectural designers to explore the potential of building retrofits. The digital algorithms combined existing graph-based analysis and design automation research with scalable computational geometry workflows and algorithms that are needed for large-scale urban analytics and estimation of building retrofit potentials.

  • The installation at the 19th International Architecture Exhibition of La Biennale di Venezia, curated by Carlo Ratti, creates a physical snapshot of the digital floor plan automation algorithms.

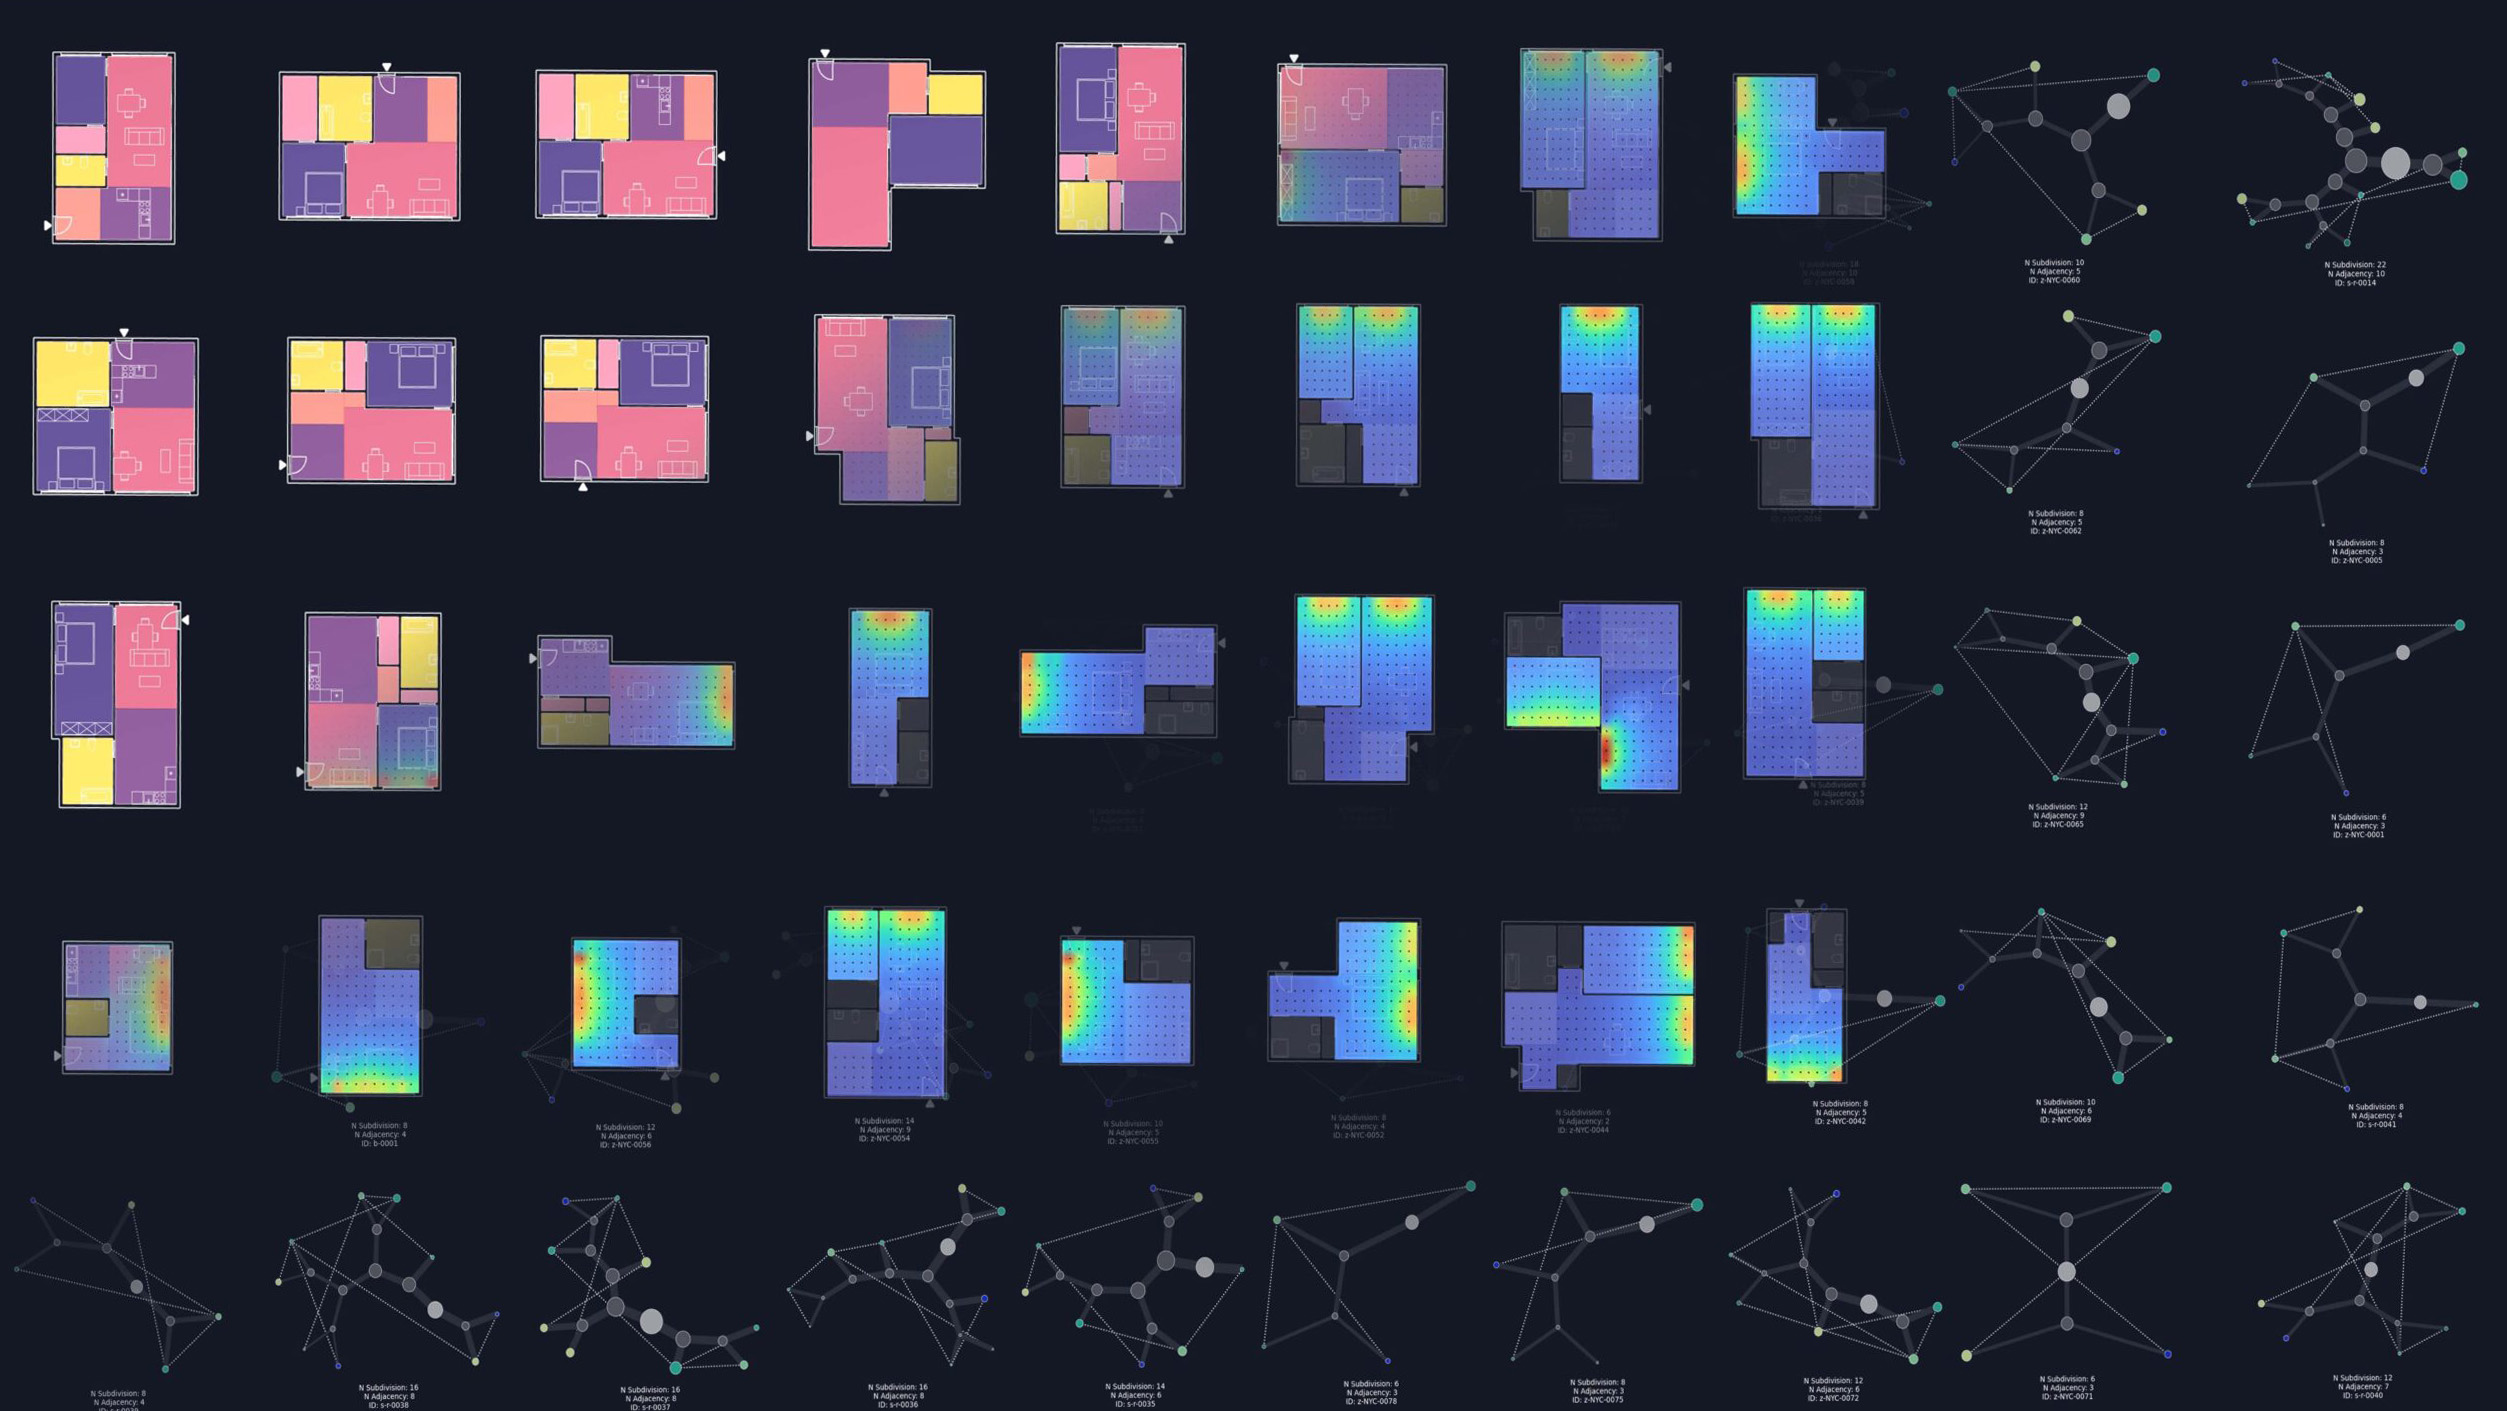
    A database of 144 floor plans is distributed over a plinth. Each unique floor plan has a corresponding hypergraph representation. The nodes and lines in the hypergraphs are physically represented through 3D printed nodes and aluminum struts.

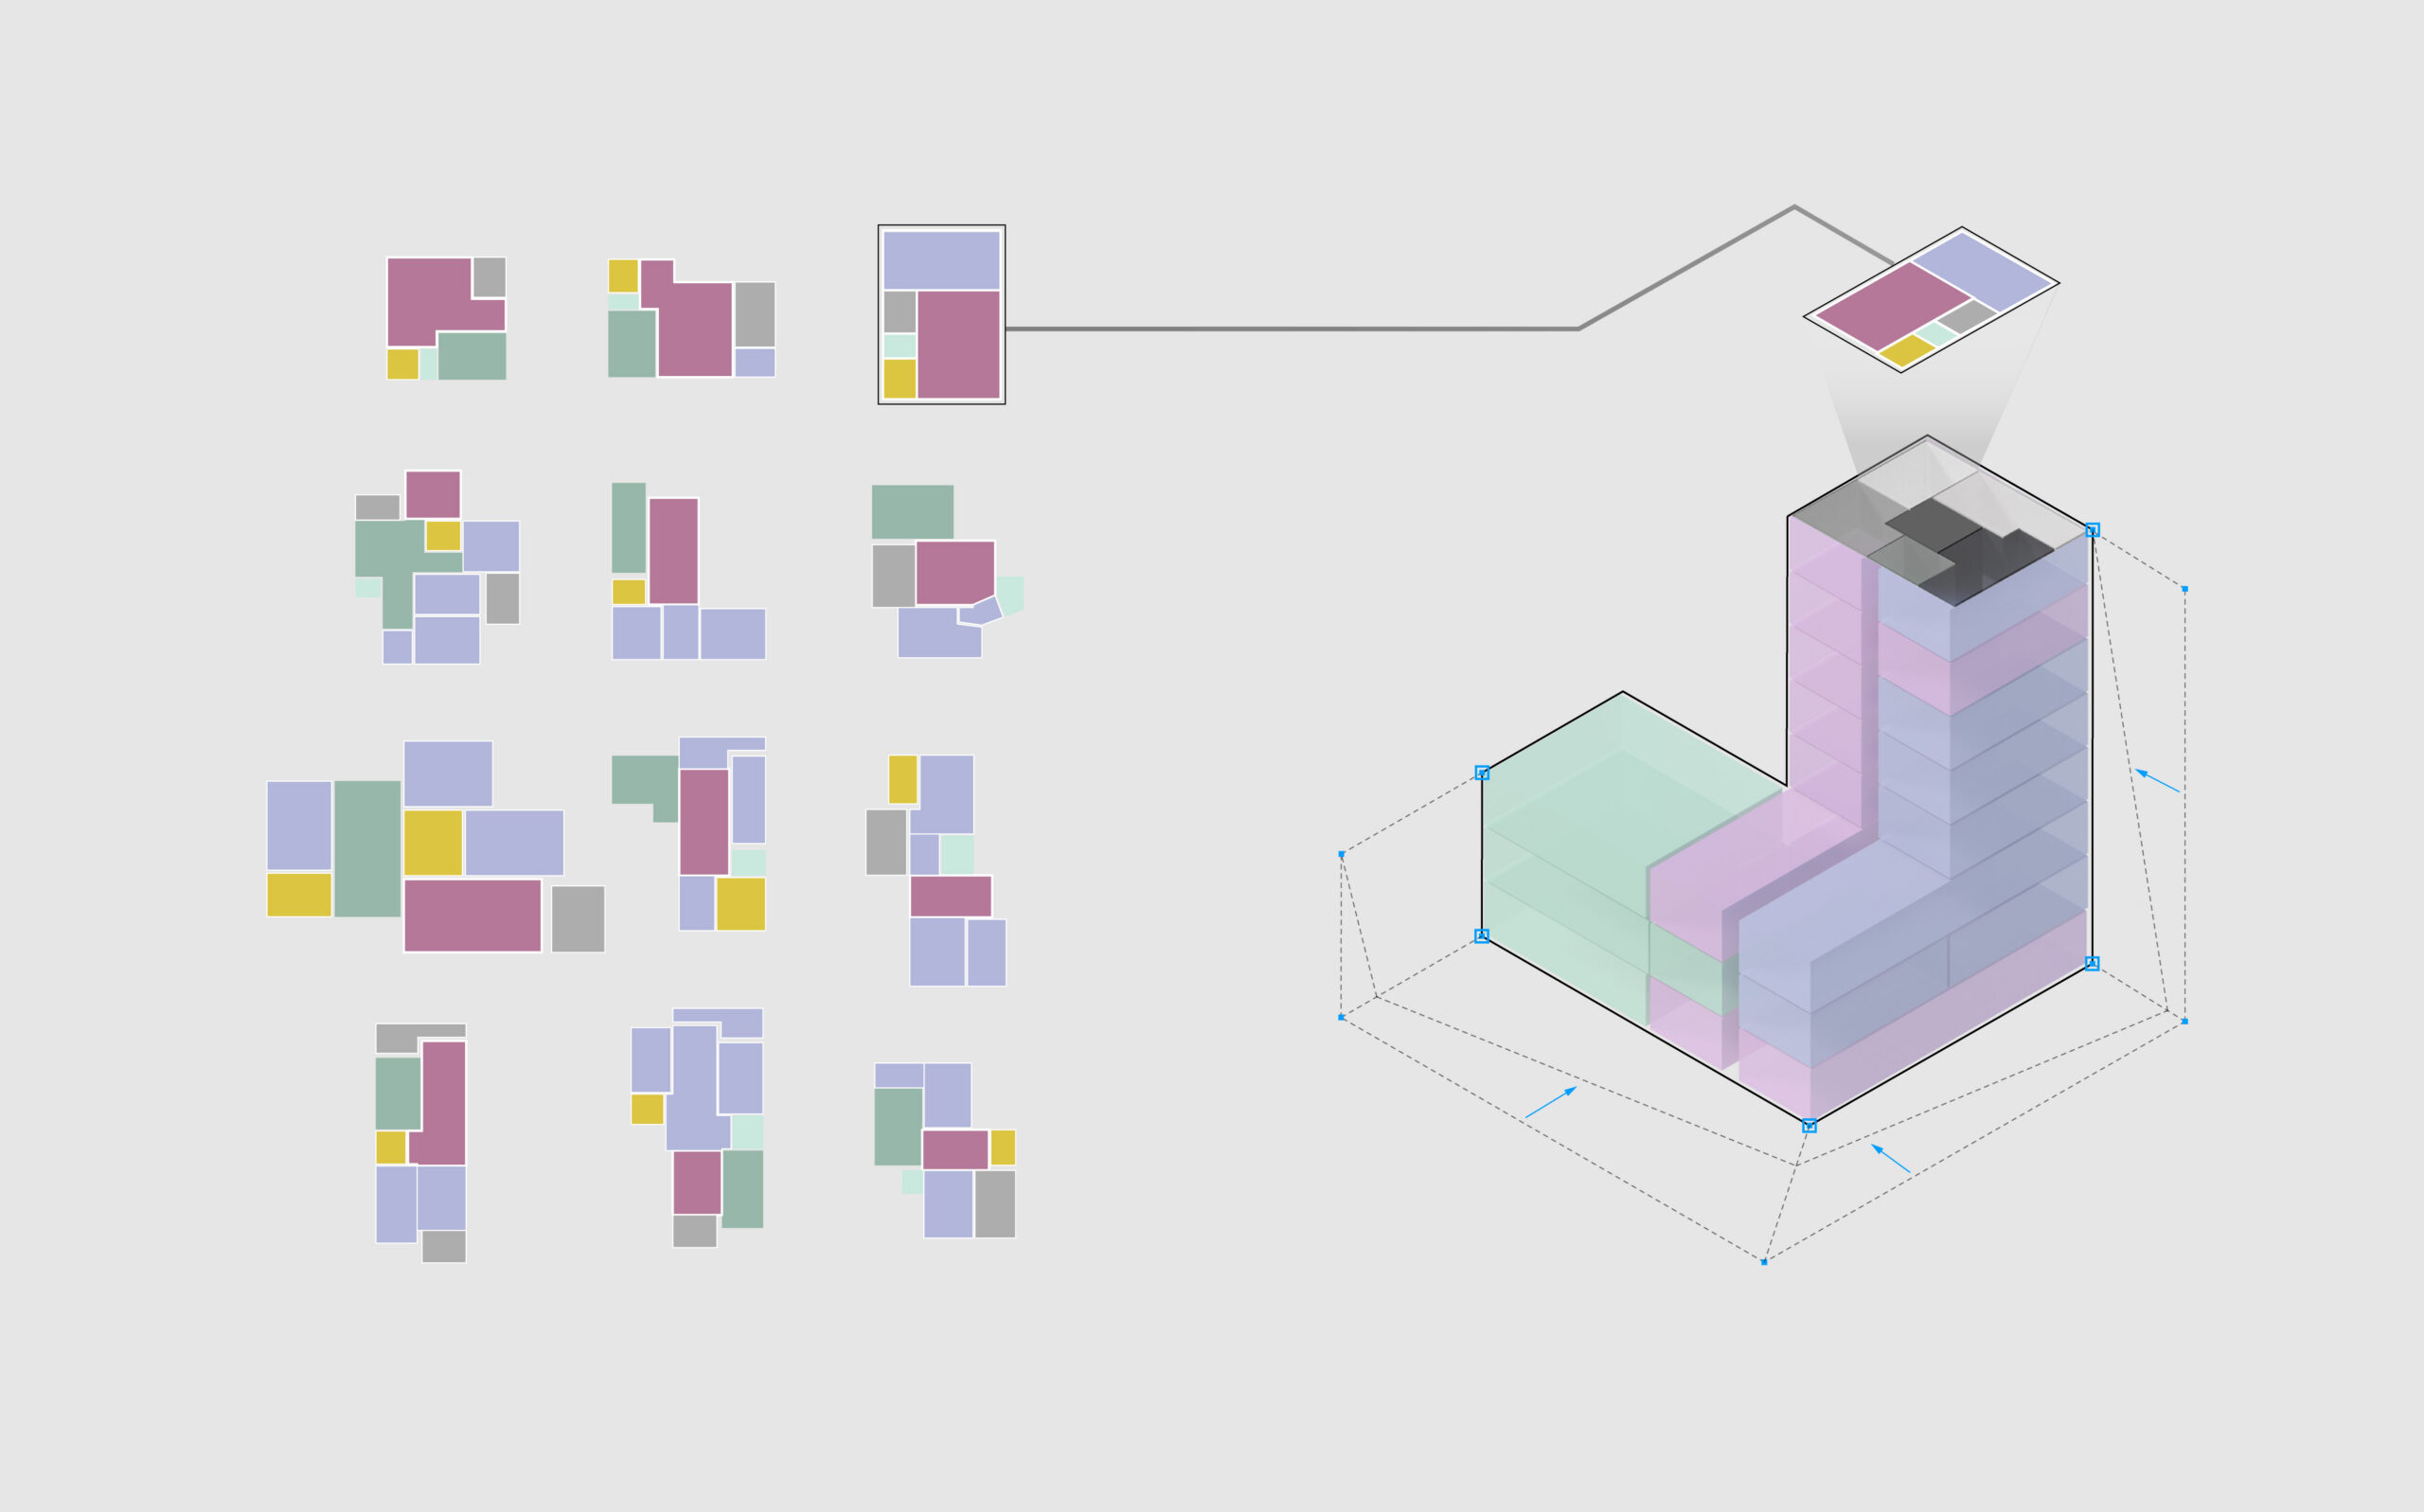
    Four buildings with the same outlines hover over the database and pick and choose different floorplans underneath them. The hypergraphs of the chosen floorplans are extracted and projected into the building. The selected floorplans are adjusted to the new apartment boundaries inside the building and create different internal configurations. An environmental simulation assesses the performance of each layout in terms of daylight, energy use and spatial configuration.

    The work was supported by the University of California, Berkeley, and Cass Calder Smith Architects.

    Team:

    Ramon Elias Weber, PhD, Assistant Professor UC Berkeley

    Yuhan Zhang, Frederic Lam, Zhuoer Chen, Leah Altman, Linc Ruiz-Truong, Mia Wilson, Emma Nakoaka, Sihyeok Yang and Noel Fäh.

  • The published research is available open access: Nature Communications 2024. A hypergraph model shows the carbon reduction potential of effective space use in housing. Ramon Elias Weber, Caitlin Mueller, Christoph Reinhart

    Cite — BibTeX
    @article{weber2024hypergraph,
      title     = {A hypergraph model shows the carbon reduction potential of effective space use in housing},
      author    = {Weber, Ramon Elias and Mueller, Caitlin and Reinhart, Christoph},
      journal   = {Nature Communications},
      volume    = {15},
      number    = {1},
      pages     = {8327},
      year      = {2024},
      month     = sep,
      issn      = {2041-1723},
      publisher = {Nature Publishing Group},
      doi       = {10.1038/s41467-024-52506-z},
      url       = {https://doi.org/10.1038/s41467-024-52506-z}
    }

    The new algorithm for the generative design of building floor plans – the hypergraph – enables the real-time creation and manipulation of the complex geometric relationships found in architectural floor plans.

    The hypergraph captures both the spatial subdivisions and adjacency relationships between the different rooms. With this, each floor plan has a specific and unique hypergraph that represents its spatial topology.

    The same hypergraph can be applied to different boundaries to create floor plan. Different hypergraphs can be applied to the same boundary to create different internal configurations.

    New design tools for architects allow real-time manipulation of floor plans. Integrating directly with building performance simulation tools, automated building energy, daylight and embodied carbon analysis can be conducted.

    How can we best learn from the design intelligence of existing buildings? How can we best integrate new types of Artificial Intelligence into the design of new buildings?

    Digital to Physical

    A hypergraph is extracted from an existing layout.
    Different hypergraphs are applied to a boundary, creating a unique layout.

  • Almost 40% of global carbon emissions can be attributed to the building sector, which makes the built environment both a liability and an opportunity to mitigate climate change. Building for Zero summarizes the challenges the building industry faces on the way to zero emissions. A global scenario and an interactive calculator show how embodied and operational carbon, retrofit rates and grid decarbonization relate to each other.

    Ramon Weber, Caitlin Mueller, Christoph Reinhart · Digital Structures Group & Sustainable Design Lab, MIT · 2021

    The challenge

    Net zero by 2050.

    International organizations and many countries have set the goal of net zero emissions for all industries by 2050 to avoid irreparable damage to our planet’s climate and ecosystems. The question is whether and how society can meet this target.

    Decrease of global emissions needed to stay below the 2.0 °C climate goal, with the share of the building stock
    Decrease of the global emissions necessary to stay below the 2.0 °C global climate goal.

    The world

    Global floor area will almost double.

    The United Nations and the International Energy Agency estimate that the floor area of all buildings in the world will almost double from 2017 to 2050. The ratio between existing and newly built area varies greatly between regions, so different strategies are needed for making new buildings more sustainable and for retrofitting the existing building stock.

    World map with projected existing and new building floor area per region in 2050
    Projected global building area in 2050. Data source: Wörsdörfer et al. 2019.

    The model

    Three scenarios for the built environment.

    To understand what global carbon budgets mean for buildings, housing policy and development, we model carbon emissions from buildings between now and 2050. Business as usual assumes a 1% renovation rate and a linear decrease of building operation emissions to net zero until 2050. Net Zero Operational Carbon assumes a 5% renovation rate and a linear decrease of operational emissions to net zero between 2030 and 2040. Net Zero Operational and Embodied Carbon assumes, in addition, a linear decrease of embodied carbon for construction and maintenance to zero between 2030 and 2040.

    Yearly carbon emissions from the built environment until 2050 in three scenarios
    Yearly emissions from the built environment in three scenarios. Global floor areas and operational emissions are based on projections by the International Energy Agency.

    The calculator

    Try it: can the building stock stay within its carbon budget?

    The interactive calculator estimates the carbon emissions of the global building stock until 2050 for the three scenarios. Four inputs can be changed: 1) the global emission scenario and carbon budget, based on one of five shared socioeconomic pathways (only SSP-1 has a probability of reaching the UN climate goals); 2) the global annual building renovation rate; 3) the year by which all new construction is carbon neutral in operation; and 4) the year by which all new construction is carbon neutral in embodied carbon. The outputs show yearly emissions until 2050 and whether each scenario stays under the carbon budget set by the IPCC.

    Loading interactive calculator…

    The models are published open-source on Observable. The full methodology is outlined in the report.

    Report

    Building for Zero, The Grand Challenge of Architecture without Carbon
    Ramon Weber, Caitlin Mueller, Christoph Reinhart
    SSRN Electronic Journal, 2021 · https://doi.org/10.2139/ssrn.3939009

    Cite — BibTeX
    @article{weber2021buildingforzero,
      title     = {Building for Zero, The Grand Challenge of Architecture without Carbon},
      author    = {Weber, Ramon and Mueller, Caitlin and Reinhart, Christoph},
      journal   = {SSRN Electronic Journal},
      year      = {2021},
      issn      = {1556-5068},
      publisher = {Elsevier},
      doi       = {10.2139/ssrn.3939009},
      url       = {https://doi.org/10.2139/ssrn.3939009}
    }
  • Automated floorplan generation in architectural design: A review of methods and applications. Ramon Elias Weber, Caitlin Mueller, Christoph Reinhart. Automation in Construction, 2022. https://doi.org/10.1016/j.autcon.2022.104385

    Cite — BibTeX
    @article{weber2022floorplan,
      title     = {Automated floorplan generation in architectural design: A review of methods and applications},
      author    = {Weber, Ramon Elias and Mueller, Caitlin and Reinhart, Christoph},
      journal   = {Automation in Construction},
      volume    = {140},
      pages     = {104385},
      year      = {2022},
      month     = aug,
      issn      = {0926-5805},
      publisher = {Elsevier},
      doi       = {10.1016/j.autcon.2022.104385},
      url       = {https://doi.org/10.1016/j.autcon.2022.104385}
    }

    ↗ Link to pdf

    Accommodating predicted population growth and urbanization within the UN Climate Goals poses a significant challenge for disciplines that engage with the built environment. High performing buildings of the future should offer spatial quality for their users while utilizing resources as efficiently as possible for both construction and operation. In this review, we survey the value proposition of automatic floorplan layout generation methods and their opportunities for design guidance, feedback, and optimization in the creation of new buildings, in addition to applications for inventory characterization to survey existing housing stock and guide building policy and code. We divide existing methods into three categories: bottom-up methods, top-down methods, and referential methods. We explore advantages and challenges for each approach and propose a hybrid method for future building layout automation that utilizes a new set of metrics to create sustainable buildings of the future.

    Schematic of bottom-up automatic space layout design methods. Starting with a definition of members and objectives, an initial aggregation and adjustment transforms the individual parts themselves. An objective function evaluates the outcome and drives local and global parameters to adjust the outcome.
    Schematic of top-down automatic space layout creation methods. Starting with a definition of boundary conditions, members and objective functions, an initial subdivision is evaluated by the objective function. Adjustment of the subdivision parameters results in a final structure.
    Schematic of referential automatic space layout creation methods. Starting with a dataset (catalogue) of existing structures. A desired property is extracted
    from the dataset and a model prepared and trained as neural net, TSP or referential data cluster. The model is applied to a user specified problem formulation and
    postprocessed into geometric data resulting in a final structure.
  • Generative Structural Design for Embodied Carbon Estimation
    Ramon Elias Weber, Caitlin Mueller, Christoph Reinhart
    Proceedings of the IASS Annual Symposium 2020/21 and the 7th International Conference on Spatial Structures, 2021 · PDF

    Cite — BibTeX
    @inproceedings{weber2021generative,
      title        = {Generative Structural Design for Embodied Carbon Estimation},
      author       = {Weber, Ramon Elias and Mueller, Caitlin and Reinhart, Christoph},
      booktitle    = {Proceedings of the IASS Annual Symposium 2020/21 and the 7th International Conference on Spatial Structures: Inspiring the Next Generation},
      editor       = {Behnejad, S. A. and Parke, G. A. R. and Samavati, O. A.},
      year         = {2021},
      month        = aug,
      address      = {Guildford, UK},
      organization = {International Association for Shell and Spatial Structures (IASS)}
    }

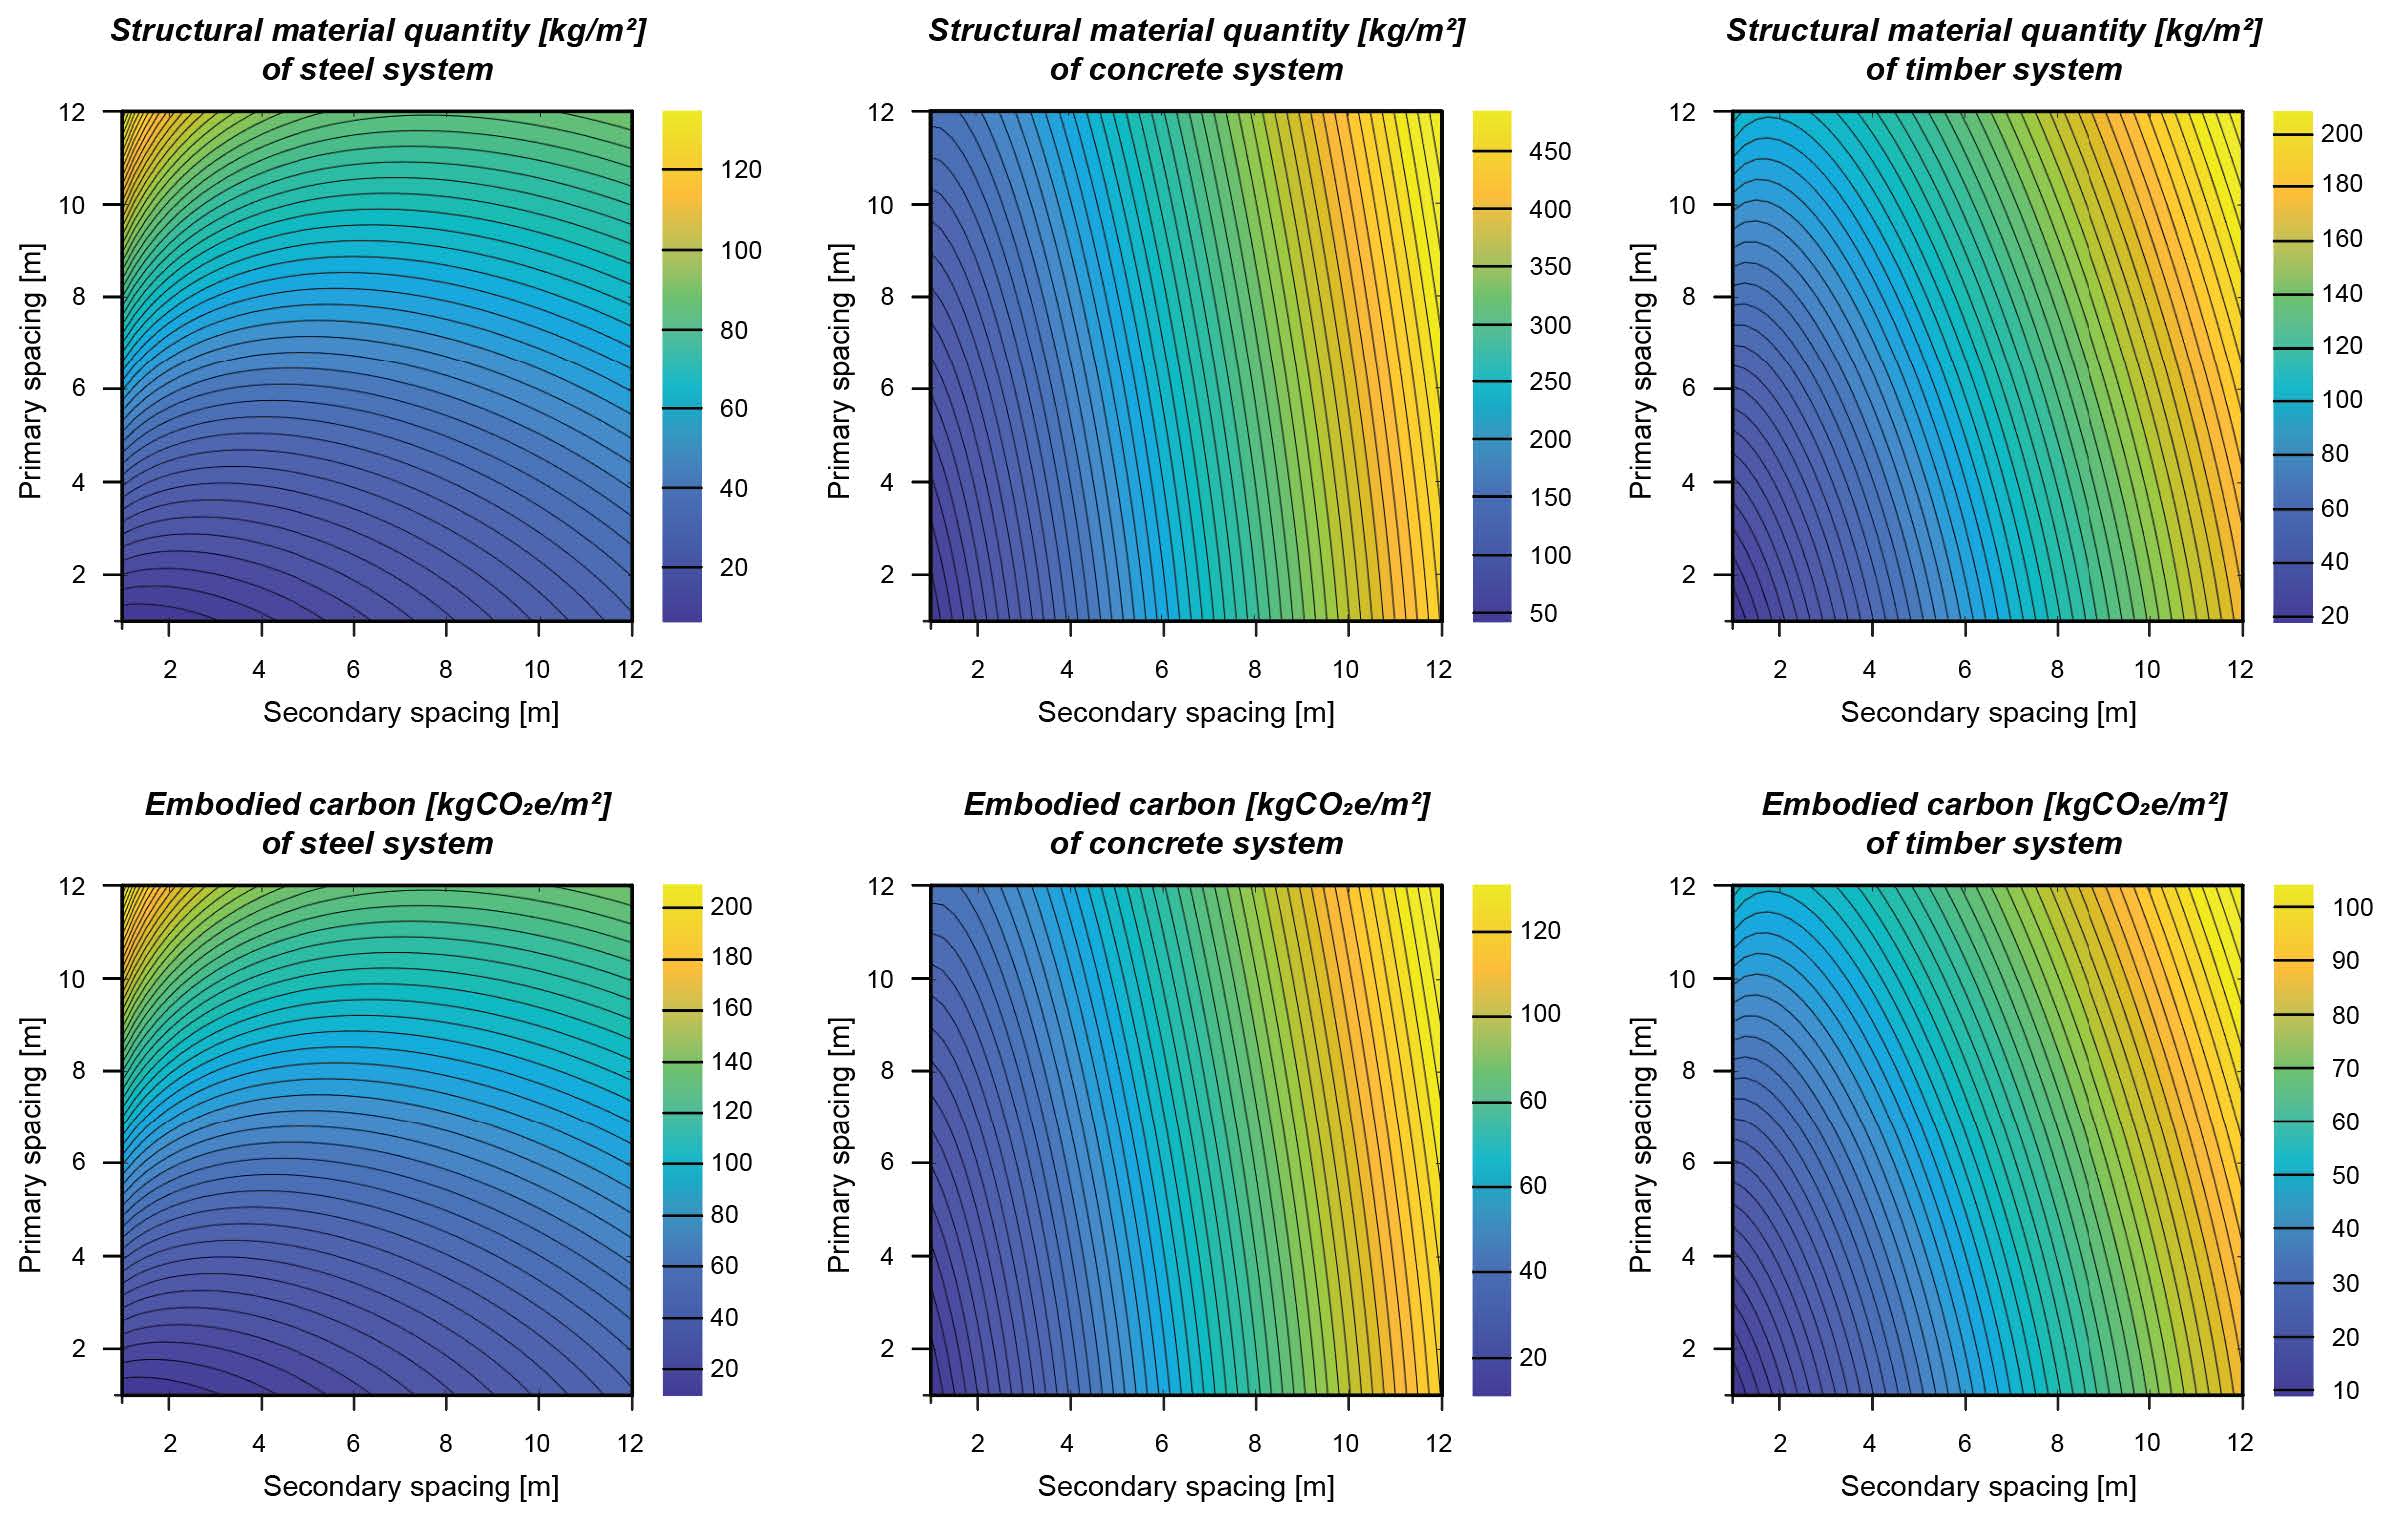
    This research proposes a new strategy for estimating the embodied carbon in existing residential and commercial buildings. Most critical in this estimation is the structural system, up to two thirds of the whole embodied carbon of a building. Existing benchmarks rely on area normalized carbon content values that do not take the scaling effects of spatial structures – both horizontally and vertically – into account. The embodied carbon of a structure can be greatly over- or underestimated based on its effective size, when assessed with square meter averages or typological approaches from existing databases.

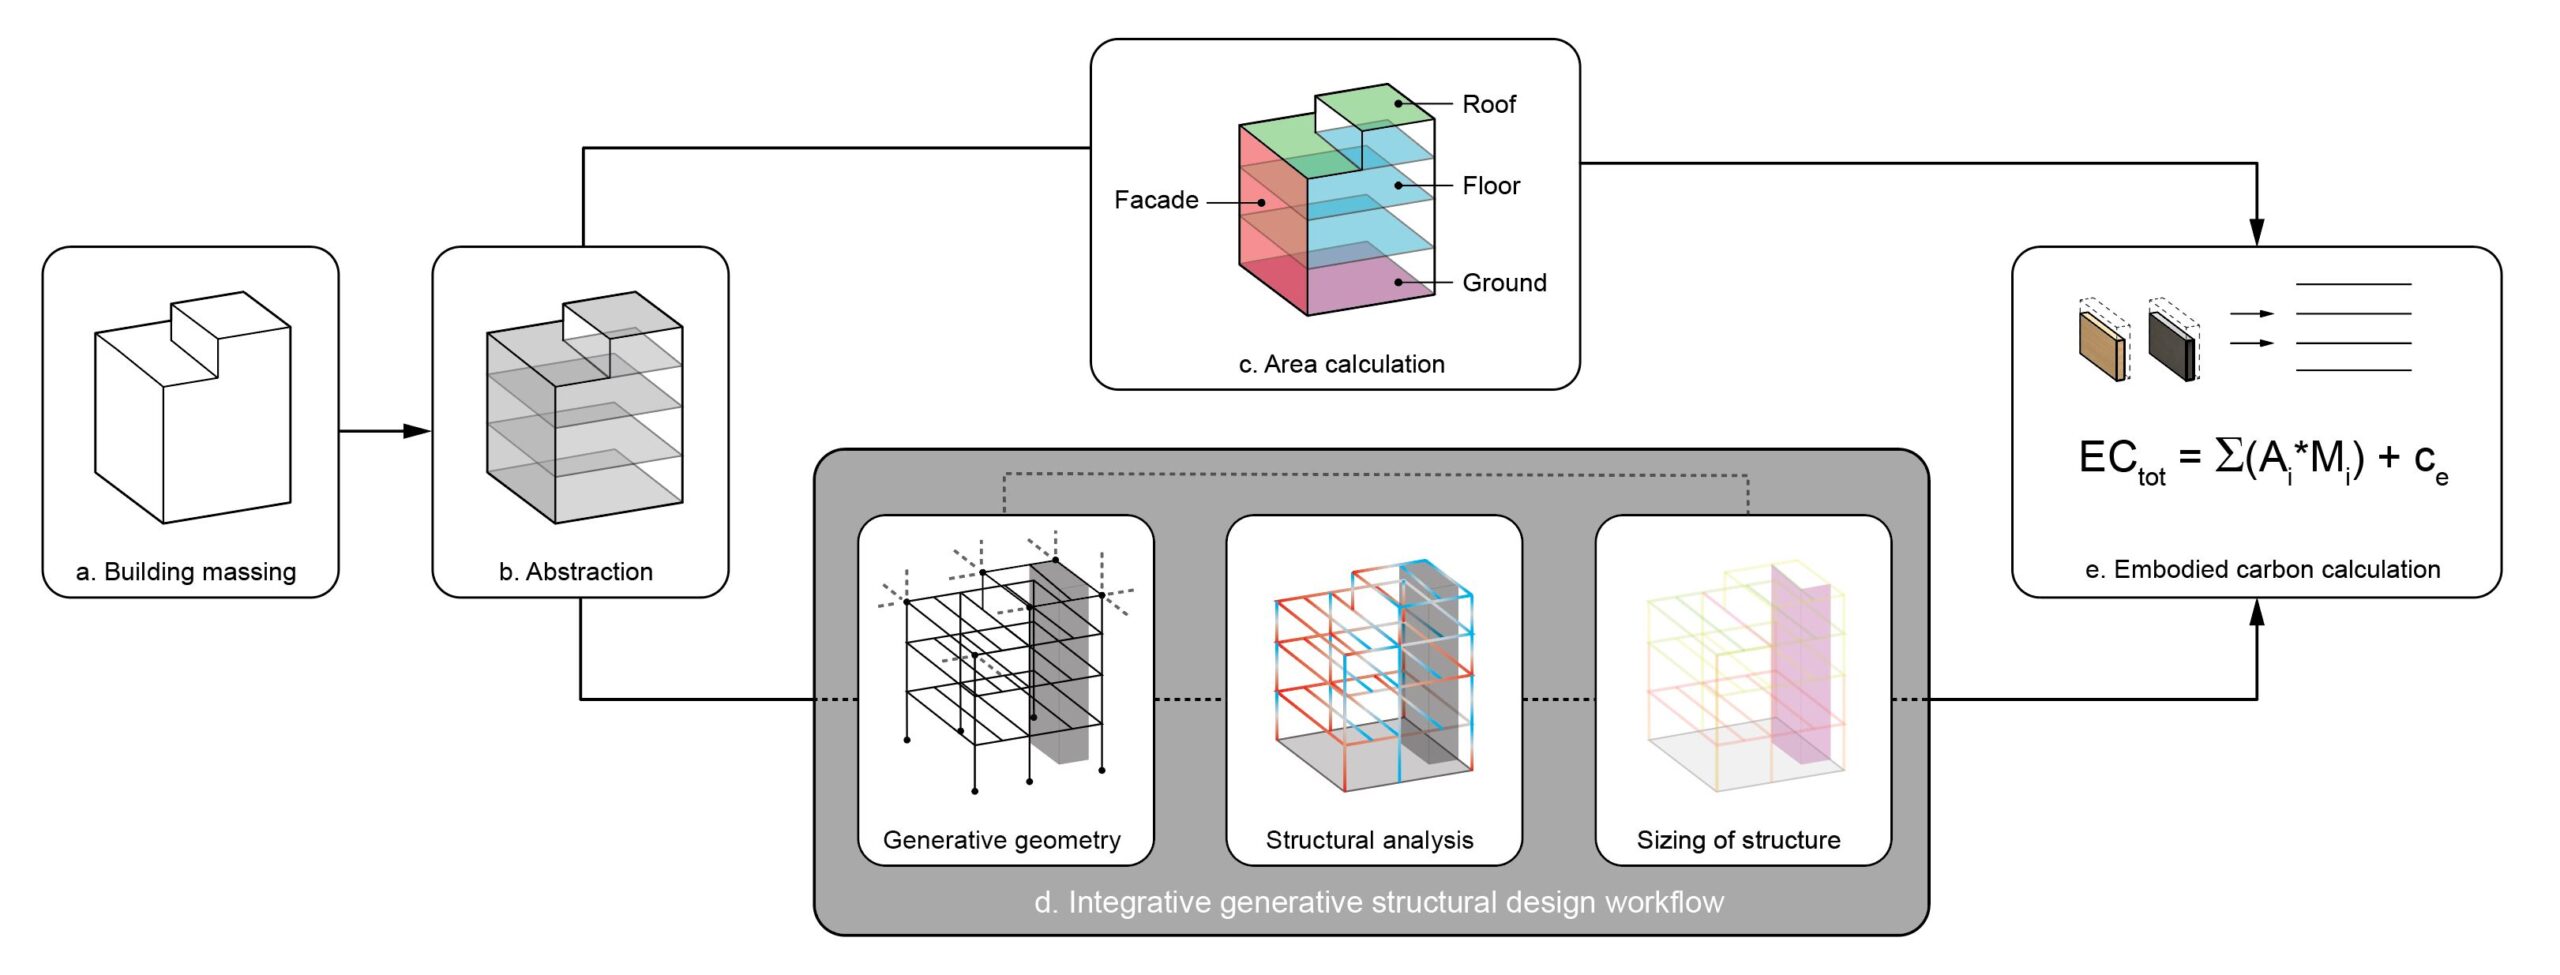
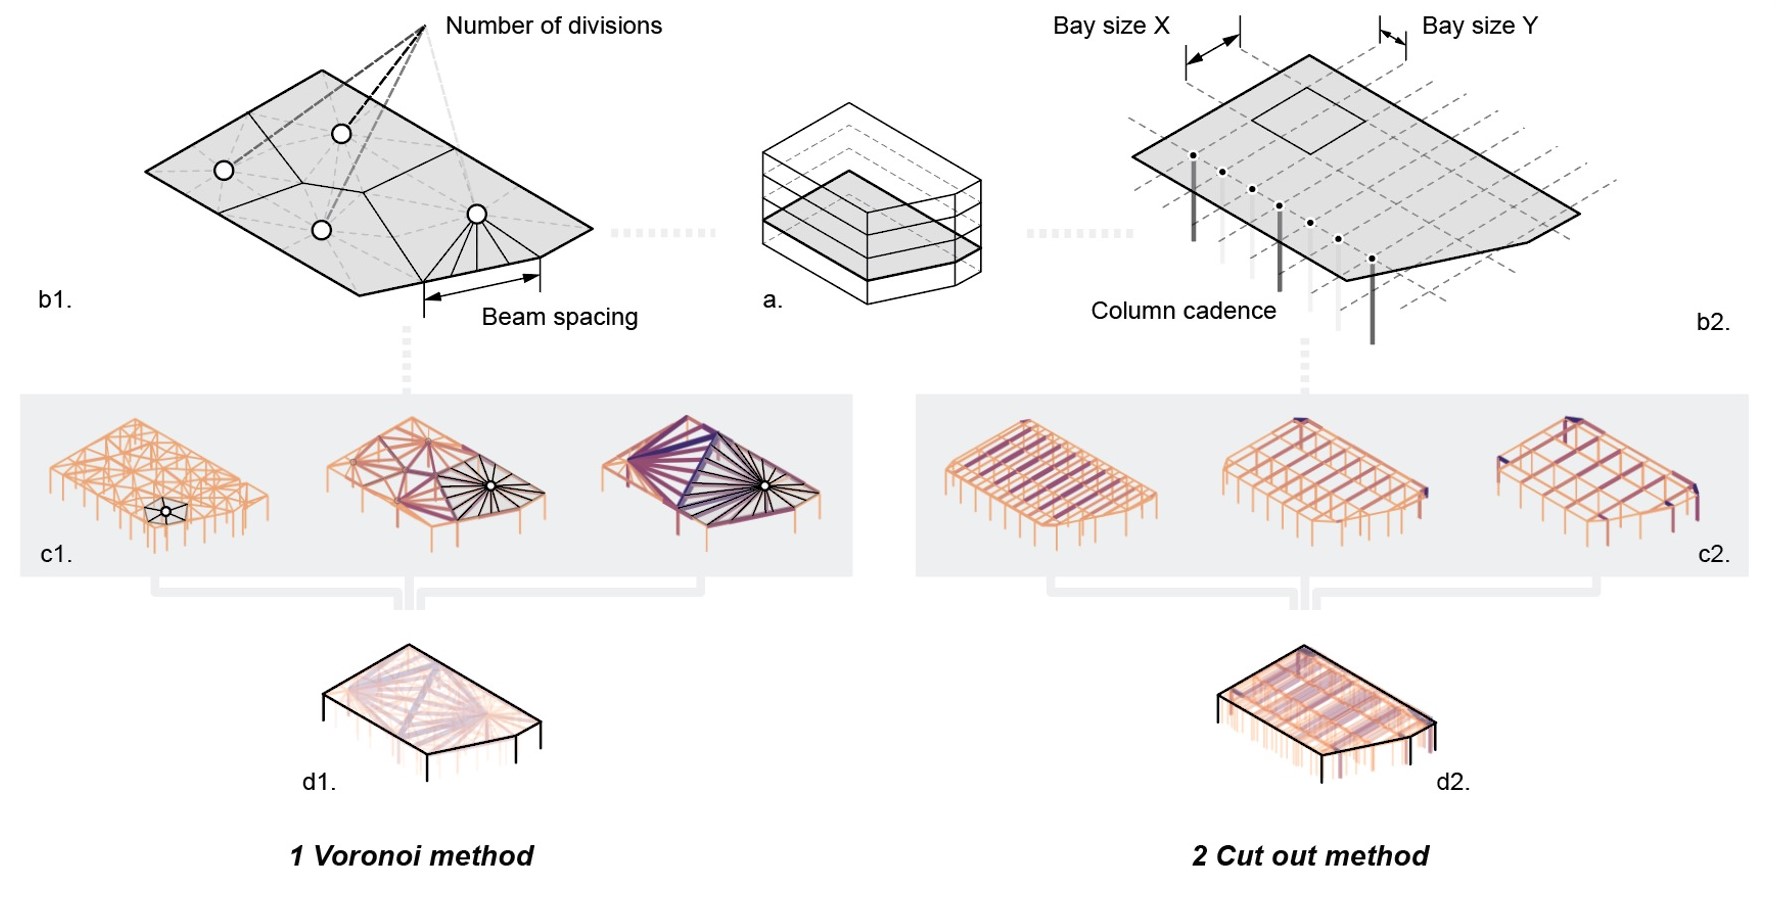
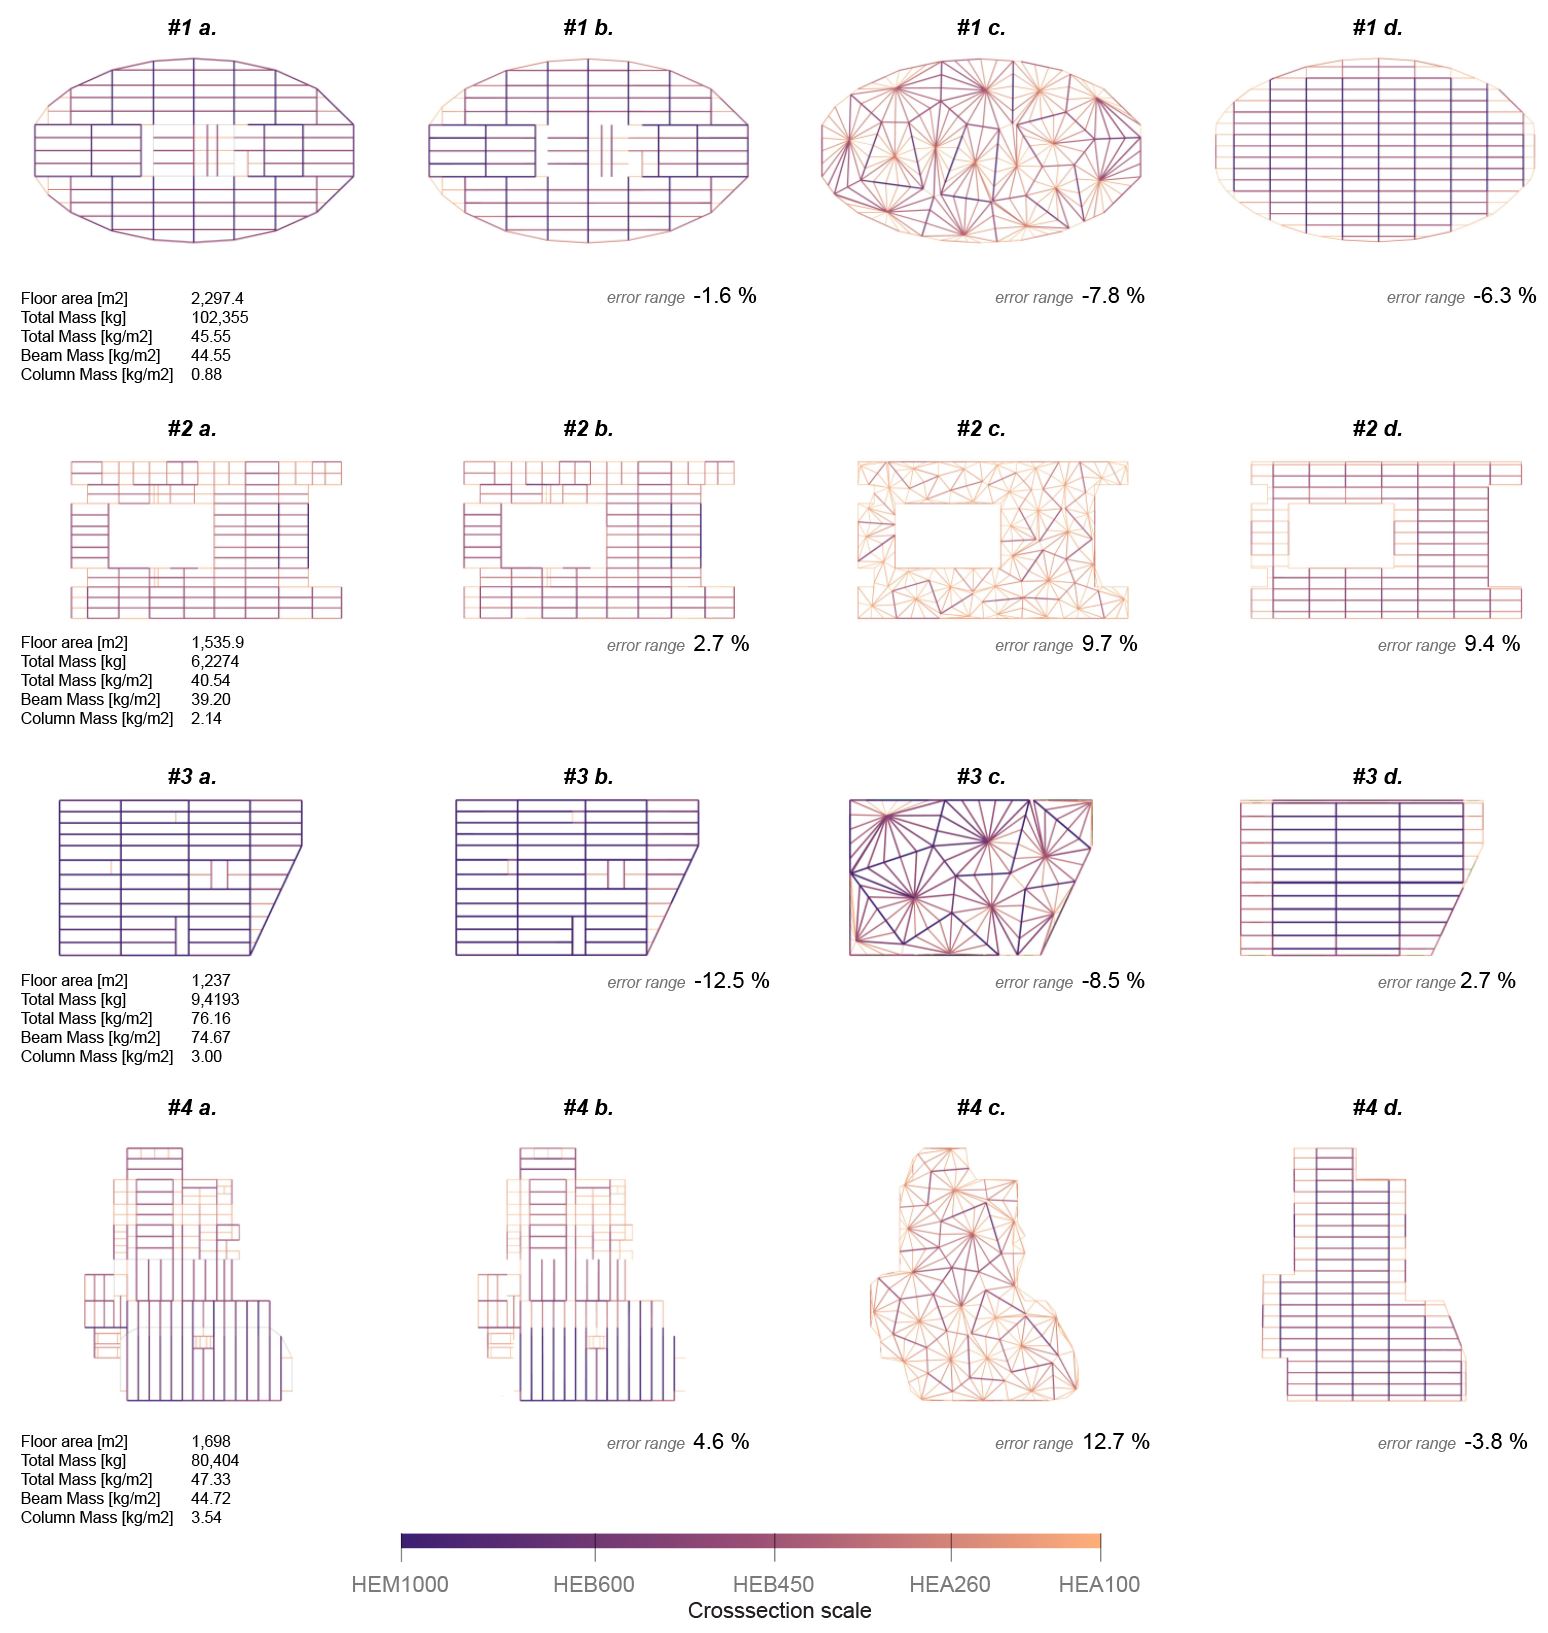
    We introduce an automated workflow that leverages generative structural design for the creation of a structurally-sound building model. Specifically, our method is applicable for large scale steel framing systems that are widely used for commercial developments. With this generative approach, we can accurately and instantly calculate the structural quantities and embodied carbon of a structural framing system without the need for manual input. The method is scalable to urban-level assessment. We show how calibrated simulation results achieve a sub 17% error margin when compared with real-world buildings.

    Traditional workflow for embodied carbon estimation
    Proposed workflow, using generative structural design for embodied carbon estimation

    Structural material quantities do not scale linearly, why should embodied carbon coefficients of whole buildings?
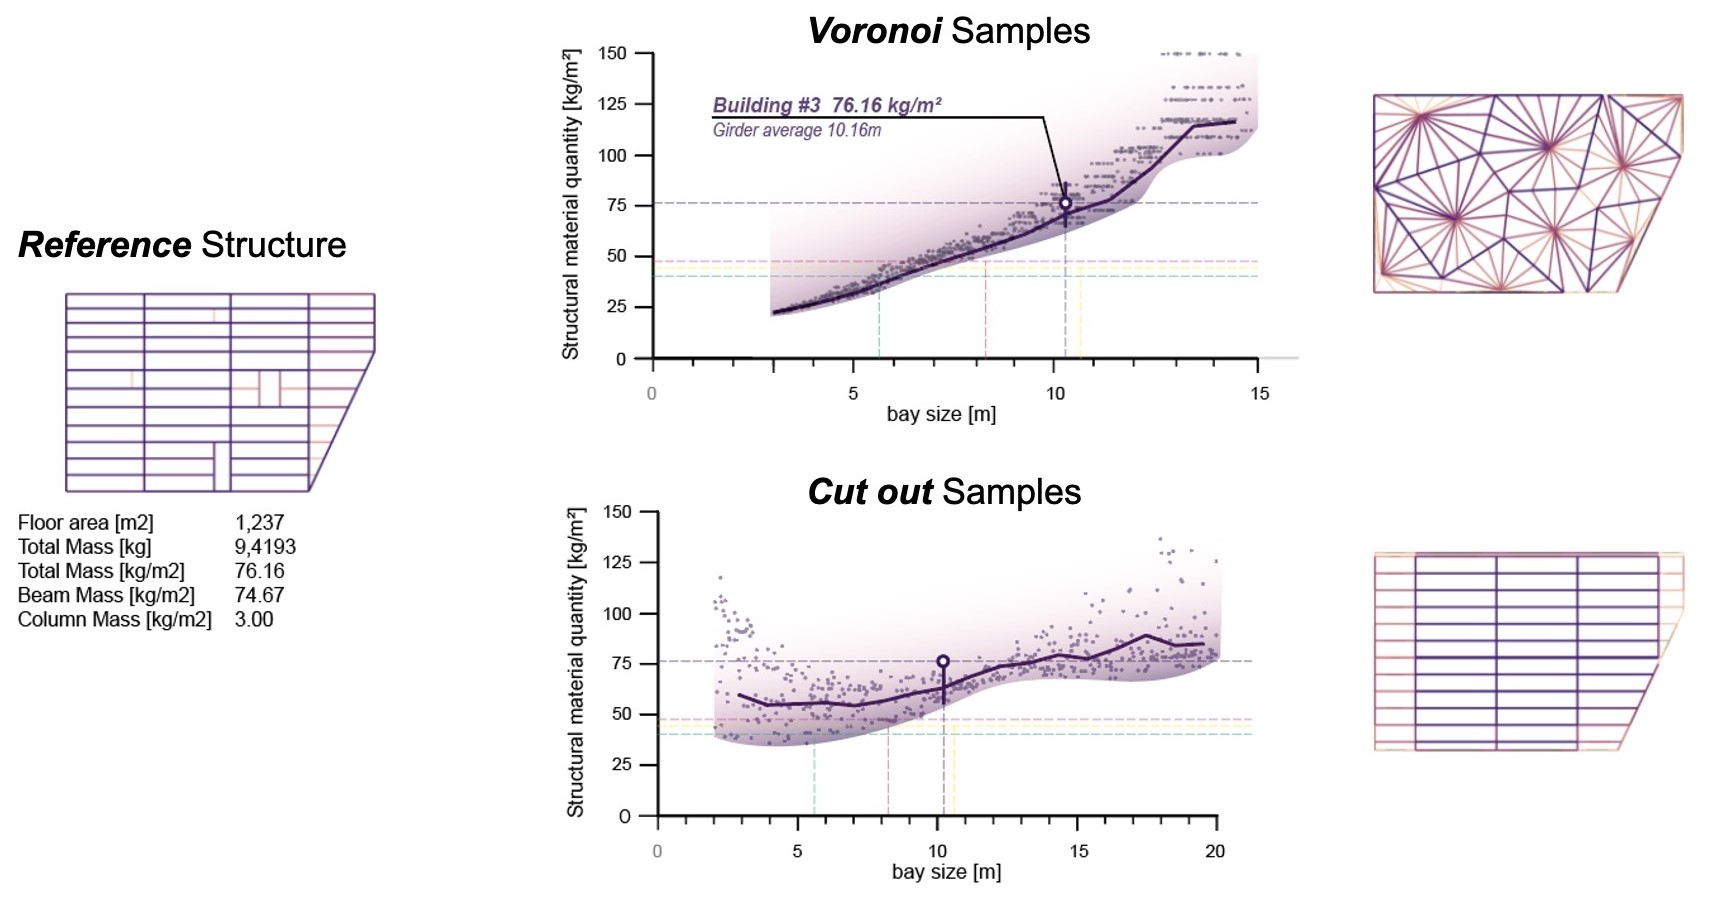
    Voronoi (1) and Cut Out (2) method take a floor slab of an existing massing as an input (a.). Both methods adaptively subdivide the floor area (b1., b2.) to create a variety of layouts with differentiated bay sizes and beam spacings (c1., c2.). An average of quasi optimal solutions leads to the predicted weight and sizing of the structure (d1., d2.)
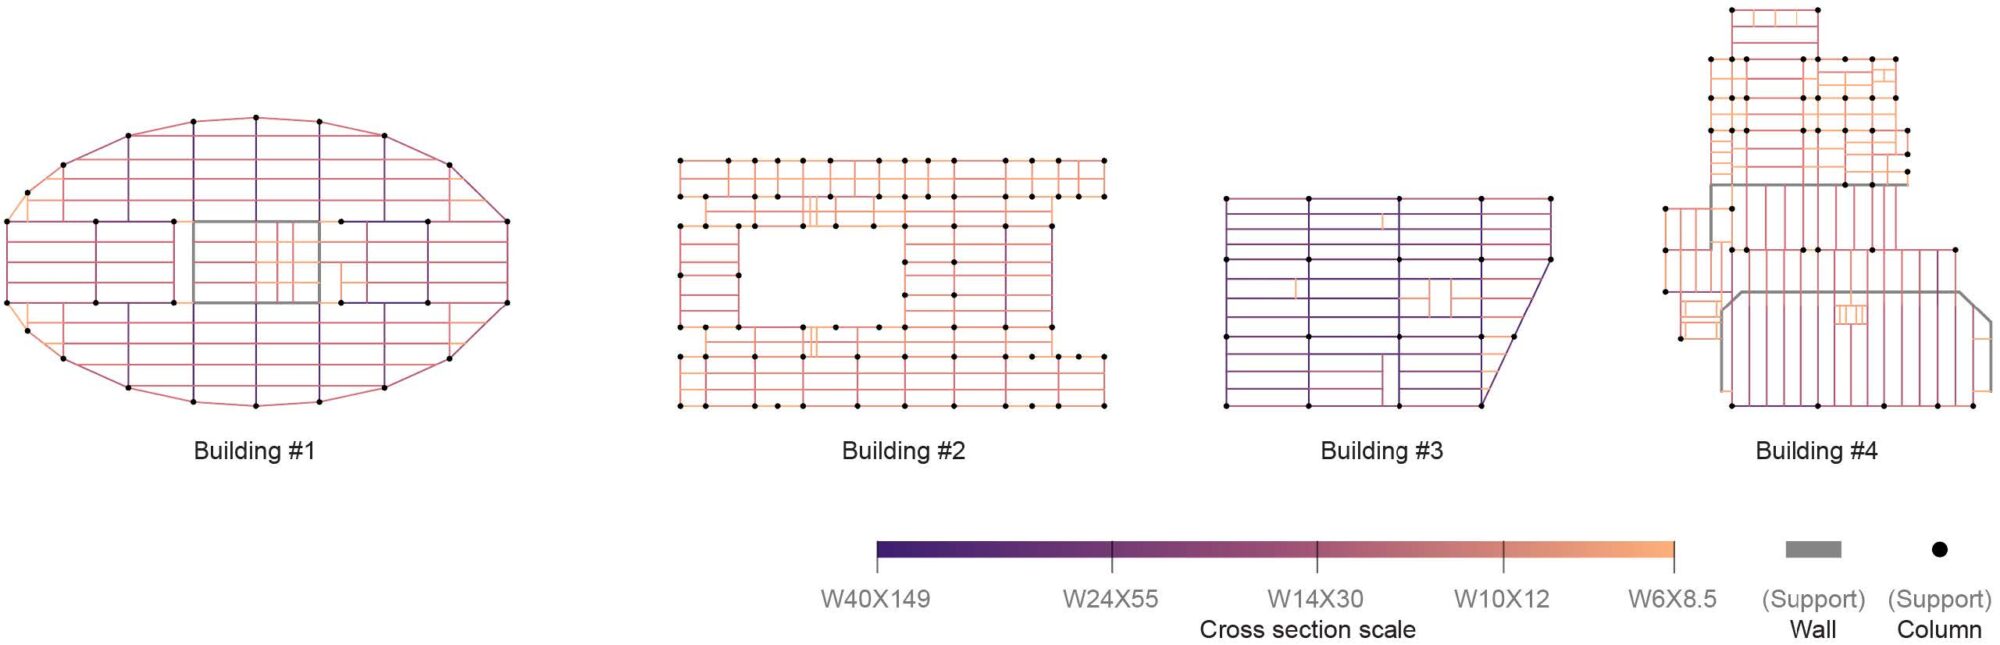
    Steel framing plans of case study buildings
    Accurate estimation of a buildings embodied carbon through generative models